


EUR/USD – Bigger Pullback or Something More?
Currencies / Forex Trading Jul 04, 2014 - 11:58 AM GMTBy: Nadia_Simmons

 Earlier today, the euro moved lower against the greenback after the U.S. Department of Labor reported that non-farm payrolls rose by 288,000 in June, beating expectations for an increase of 212,000. Meanwhile, the unemployment rate dropped to 6.1% from 6.3% in May. Thanks to these better-than-expected numbers, EUR/USD declined sharply and dropped below the short-term support. What impact could it have on future moves?
In our opinion, the following forex trading positions are justified - summary:
EUR/USD: none
GBP/USD: none
USD/JPY: none
USD/CAD: none
USD/CHF: none
AUD/USD: none
EUR/USD
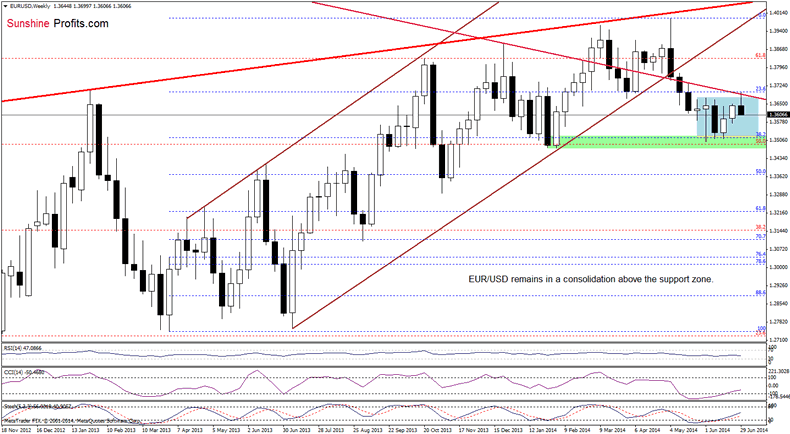
The situation in the medium term has deteriorated as EUR/USD extended losses below the previously-broken upper line of the consolidation and the long-term resistance line. From this perspective, it seems that the next downside target for forex traders will be last week’s low of 1.3574.
What can we infer from the daily chart?
Quoting our last commentary:
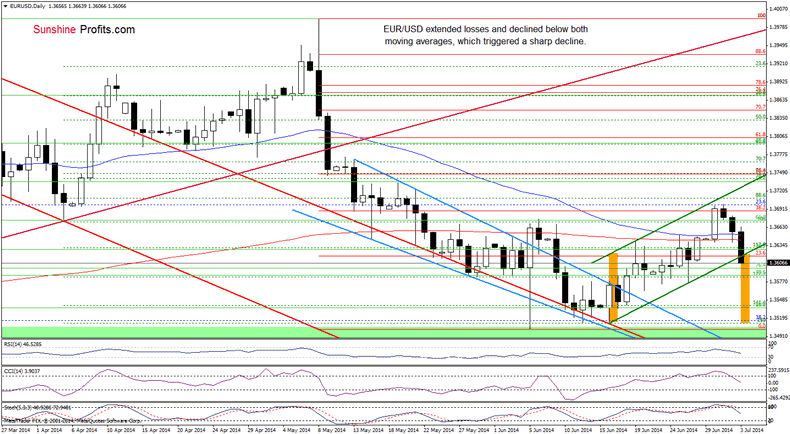
(…) taking into account the current position of the indicators and combining it with the medium-term picture, it seems to us that we’ll see further deterioration in the coming days. If this is the case, the next downside target will be around 1.3564-1.3575, where the bottom of the previous correction is.
On the daily chart, we see that EUR/USD declined below the support zone created by the 50- and 200-day moving averages, which triggered a sharp decline that took the pair below the very short-term green support line. As you see on the above chart, this is also the lower border of the rising trend channel. Therefore, today’s breakdown below this line is a strong negative signal and we think that the exchange rate will extend current correction and we’ll realization of the above-mentioned bearish scenario. At this point, it’s worth noting that if the nearest support area doesn’t hold, we’ll see further deterioration and the next target will be around 1.3520, where the size of the downswing will correspond to the height of the trend channel. Please not that the current position of the indicators also favors currency bears as sell signals remain in place.
Very short-term outlook: bearish
Short-term outlook: mixed with bearish bias
MT outlook: bearish
LT outlook: bearish
Trading position (short-term): In our opinion no positions are justified from the risk/reward perspective at the moment.
USD/JPY
The situation in the medium term hasn’t changed much as USD/JPY remains between the medium-term support/resistance and the May low of 100.81. Today, we’ll take a closer look at the very short-term picture.
Yesterday, we wrote the following:
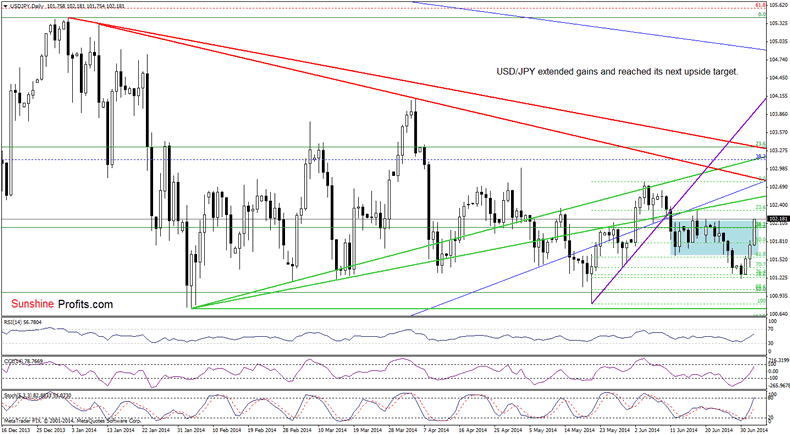
(…) the RSI rebounded, while the CCI and Stochastic Oscillator generated buy signals, which suggests that we will also see a breakout above the lower border of the consolidation. If this is the case, the next upside target will be around 102.12, where the upper line of the formation is.
From this perspective, we see that USD/JPY moved higher, in line with our yesterday’s assumptions, and reached the above-mentioned upside target. Taking this fact into account and combining it with the current position of the indicators, we think that we’ll see further improvement in the coming day (or days) and the next target for currency bulls will be around 102.48, where the lower green resistance line is.
Very short-term outlook: bullish
Short-term outlook: mixed with bullish bias
MT outlook: mixed
LT outlook: bearish
Trading position (short-term): In our opinion no positions are justified from the risk/reward perspective at the moment.
AUD/USD
Today, we’ll focus on the very short-term changes.
Quoting our previous Forex Trading Alert:
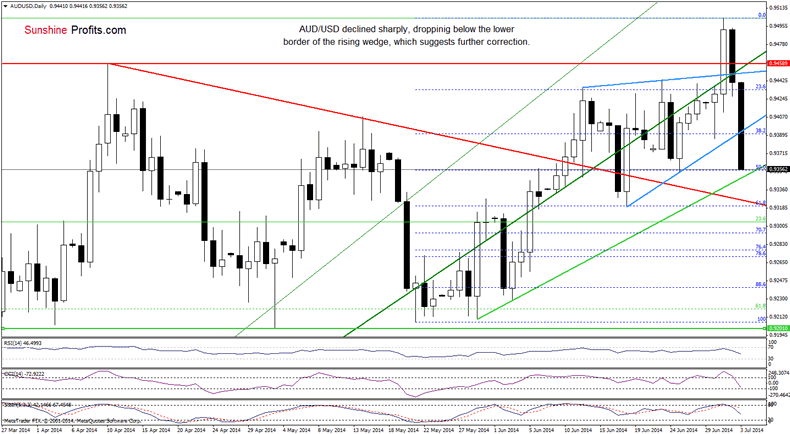
(…) although AUD/USD (…) broke above the strong resistance zone (created by the previous 2014 high and the upper line of the rising wedge), the pair reversed, invalidating earlier breakout (a strong negative sign). With this downward move, the exchange rate also dropped below the medium-term green support line, which is an additional bearish signal. On top of that, the Stochastic Oscillator generated a sell signal, while the CCI is close to doing it, which suggests that further deterioration is more likely than not. If this is the case, and the pair extends losses, the initial downside target will be the short-term green line or even the lower border of the rising wedge.
Looking at the above chart, we see that currency bears not only realized the above-mentioned scenario, but also managed to push the pair lower. As a result, AUD/USD declined below the lower border of the rising wedge, reaching the 50% Fibonacci retracement (based on the May-July rally) and approaching the short-term support line based on the May and June lows. If this support area holds, we’ll see a corrective upswing and the initial upside target will be the blue resistance line. However, if it is broken, the next downside target will be around 0.9321-0.9327, where the support zone (created by the red declining support line and the 61.8% Fibonacci retracement) is. Please note, that the current position of the indicators still supports the bearish scenario.
Very short-term outlook: bearish
Short-term outlook: mixed with bearish bias
MT outlook: bearish
LT outlook: bearish
Trading position (short-term): In our opinion no positions are justified from the risk/reward perspective at the moment.
Thank you.
Nadia Simmons
Sunshine Profits‘ Contributing Author
Oil Investment Updates
Oil Trading Alerts
* * * * *
Disclaimer
All essays, research and information found above represent analyses and opinions of Nadia Simmons and Sunshine Profits' associates only. As such, it may prove wrong and be a subject to change without notice. Opinions and analyses were based on data available to authors of respective essays at the time of writing. Although the information provided above is based on careful research and sources that are believed to be accurate, Nadia Simmons and his associates do not guarantee the accuracy or thoroughness of the data or information reported. The opinions published above are neither an offer nor a recommendation to purchase or sell any securities. Nadia Simmons is not a Registered Securities Advisor. By reading Nadia Simmons’ reports you fully agree that he will not be held responsible or liable for any decisions you make regarding any information provided in these reports. Investing, trading and speculation in any financial markets may involve high risk of loss. Nadia Simmons, Sunshine Profits' employees and affiliates as well as members of their families may have a short or long position in any securities, including those mentioned in any of the reports or essays, and may make additional purchases and/or sales of those securities without notice.
© 2005-2022 http://www.MarketOracle.co.uk - The Market Oracle is a FREE Daily Financial Markets Analysis & Forecasting online publication.