


Why the Stock Market Is STILL Cheap
Stock-Markets / Stock Market Valuations Jul 21, 2014 - 10:32 AM GMTBy: DailyWealth

 Dr. Steve Sjuggerud writes: People think U.S. stocks are expensive...
Yes, they have gone up a lot... But according to our favorite measure of stock market value, stocks are NOT expensive.
It's a simple indicator, but it encompasses the important stuff. And right now, it's telling us you could make double-digit profits in stocks over the next 12 months...
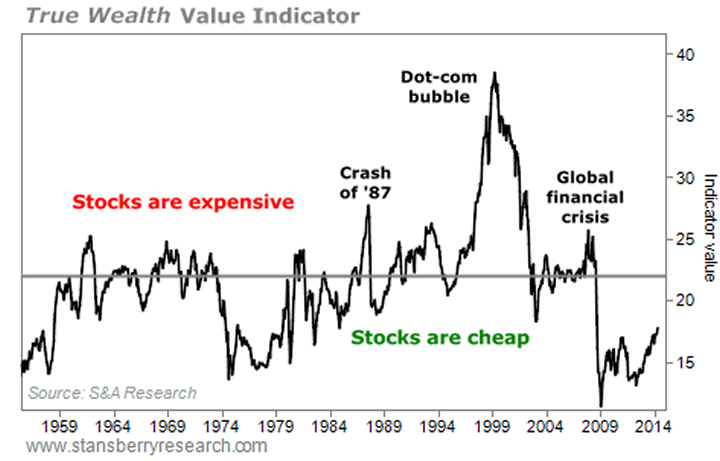
When our in-house stock market value indicator is below 22, you make double-digit profits in stocks over the next 12 months.
And when it is above 22, you lose money in stocks over the next 12 months.
Specifically:
The chart below shows our value indicator at work. You can see just how extreme the peak in stocks was in 2000... and just how extreme the bust was in 2009. Importantly, you can see that we are nowhere near the "expensive" line today. Take a look...
There are two inputs to our stock market value indicator... 1) company earnings, and 2) the economic situation.
For company earnings... we use a price-to-earnings (P/E) ratio for the market. The P/E ratio is the classic measure of value for a business. But there are brief periods where it can be an imperfect and incomplete measure of value. Our in-house indicator addresses those two things.
The P/E ratio can be imperfect as an indicator during recessions. It can jump dramatically – not because stock prices are high, but because the denominator – the "E" or earnings – goes low.
So we make a small correction to the P/E ratio when that happens. We come up with an "adjusted" P/E ratio for the market. This makes the stock market's P/E ratio much less imperfect.
The P/E ratio also doesn't fully take into account the economic situation. It's not perfect for an apples-to-apples comparison of one economic situation versus another.
Sometimes the stock market has all kinds of economic headwinds – whether it's high inflation, unemployment, or high interest rates. We saw all of these in the early 1980s.
Other times, stocks have an incredible economic tailwind – like in the early 2010s, when the Federal Reserve cut interest rates to zero with next to no inflation.
These are entirely different situations for stocks, but the classic P/E ratio doesn't distinguish between them. Our value indicator accounts for these times by using the short-term interest rate.
Surprisingly, the short-term interest rate encompasses an incredible amount of information about the current state of the economy. For example:
• The short-term interest rate will be high (likely higher than 10%) if inflation is high (say, 10%).
• The short-term interest rate will be low (like it is as I write, near zero percent) if the Federal Reserve is trying to stimulate the economy.
For our measure of the economic situation, we use the interest rate on three-month government debts (also called the 90-day Treasury-bill rate).
In short, our in-house value indicator is:
The adjusted P/E ratio + the short-term interest rate.
I'm not claiming this measure of value is a perfect one... It just offers a clearer way of assessing the current situation.
The message today is simple: stocks aren't as expensive as most people think!
Good investing,
Steve
The DailyWealth Investment Philosophy: In a nutshell, my investment philosophy is this: Buy things of extraordinary value at a time when nobody else wants them. Then sell when people are willing to pay any price. You see, at DailyWealth, we believe most investors take way too much risk. Our mission is to show you how to avoid risky investments, and how to avoid what the average investor is doing. I believe that you can make a lot of money – and do it safely – by simply doing the opposite of what is most popular.
Customer Service: 1-888-261-2693 – Copyright 2013 Stansberry & Associates Investment Research. All Rights Reserved. Protected by copyright laws of the United States and international treaties. This e-letter may only be used pursuant to the subscription agreement and any reproduction, copying, or redistribution (electronic or otherwise, including on the world wide web), in whole or in part, is strictly prohibited without the express written permission of Stansberry & Associates Investment Research, LLC. 1217 Saint Paul Street, Baltimore MD 21202
Disclaimer: The above is a matter of opinion provided for general information purposes only and is not intended as investment advice. Information and analysis above are derived from sources and utilising methods believed to be reliable, but we cannot accept responsibility for any losses you may incur as a result of this analysis. Individuals should consult with their personal financial advisors.
Daily Wealth Archive
|
© 2005-2022 http://www.MarketOracle.co.uk - The Market Oracle is a FREE Daily Financial Markets Analysis & Forecasting online publication.