EUR-AUD Heads Into The Danger Zone
Currencies / Euro Jul 24, 2014 - 06:16 PM GMTBy: Austin_Galt
 I’ve been watching the EURAUD for quite a while and finally its next big play opportunity looks about to present itself. Let’s take a look at the charts to see what exactly that is. We’ll go with my top down approach beginning with the yearly chart.
YEARLY CHART

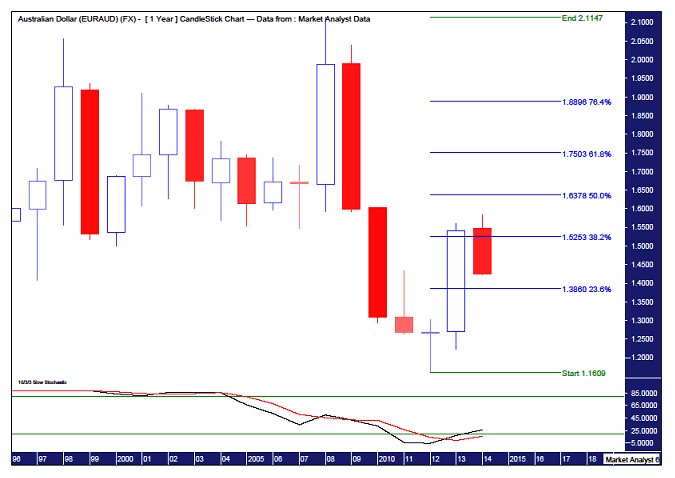
Ok, we can see a big move down took place after the 2008 high of 2.1147 putting in a low in 2011 at 1.1609. That was a new low. A lower low. Price has since rallied so perhaps a lower high is to be expected. But where will that lower high be?
I have added a Stochastic Indicator which looks to be trending up albeit in a weak position consistent with bear market rallies. So perhaps we could expect that the rally could continue for the next year or two.
I have also added Fibonacci retracement levels of the whole move down from 2008 to 2011 to help determine where exactly the rally may finally end. Currently, the 2014 top was just above the 38.2% level but this seems too short, especially for the first major rally in a bear market. I often find the first lower high (or higher low) makes a deep retracement, at least to the 61.8% level and often to the 76.4% level. These levels stand at 1.7503 and 1.8896 respectively. I favour price rallying to one of these levels with a personal preference for the 76.4% level.
Let’s move on to the monthly chart.
MONTHLY CHART

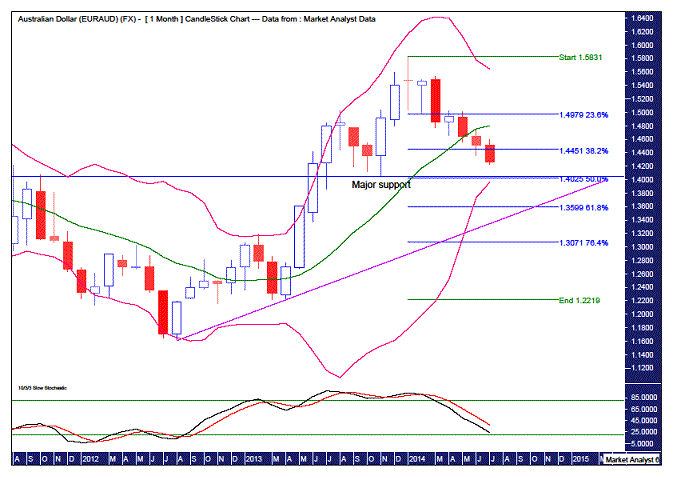
Some interesting observations to be made here. First, the Stochastic Indicator is trending down with further downside appearing likely but it is nearing low levels so one might think a turn back up can’t be too far away. But how low will it go before it does turn up, if it does at all?
I have drawn a horizontal line, labelled Major support, at the November 2013 low which stands at 1.4049. This is the danger zone for the bulls as a clear break of that level would most likely signify this current downtrend has plenty left in it, both in terms of price and time.
I have added Fibonacci retracement levels of the upleg from the April 2013 low to the January 2014 high. Interestingly, the major support level sits just above the 50% retracement level at 1.4025. The 50% level was also one of Gann’s favourite areas to look for the end of pullbacks. I’m beginning to think that price may come down and clip the major support level, running the stops that would have built up below there before reversing and putting in a false break low.
I have added some Bollinger Bands and it can be seen how price has retreated from the upper band and recently busted through the middle band seemingly on its way to the lower band. And where is the lower band? Conveniently, it is right there around the major support and 50% level. Hmmm.
As a contingency plan, if price does make a clear break of major support, then perhaps price comes back to the 61.8% level at 1.3599 and finds support where it intersects with the uptrend line I have drawn along the August 2012 and April 2013 lows. The trend line and 61.8% level look to intersect later this year in October. This is certainly a possibility but I don’t favour this scenario.
WEEKLY CHART

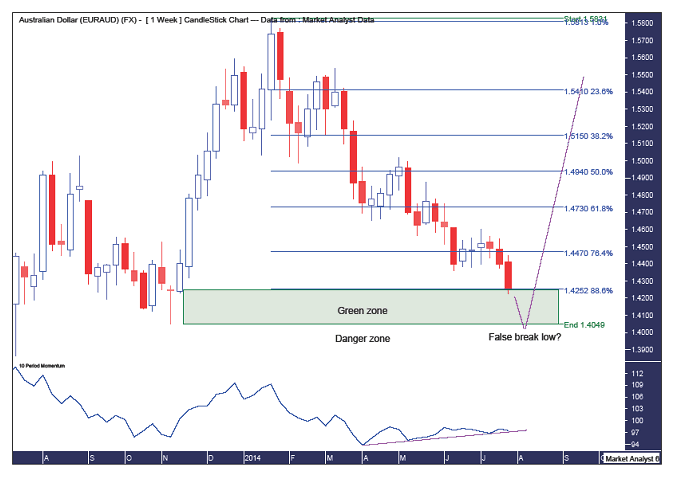
On the weekly chart, I have added Fibonacci retracement levels of the upleg from the November 2013 low to January 2014 high. Price has now hit the 88.6% level. So we are now right in the zone to look for a possible turning point.
Baghdad had its green zone and now so too does my EURAUD weekly chart. This area is between the 88.6% level and the November 2013 low. Price may stay within the walls of this zone but I suspect price will venture outside into the danger zone on a search and destroy stops mission before retreating back to the safety of the green zone. From there, with a false break low in place, price can then launch a fully fledged offensive to the upside.
Finally, I have added a Momentum Indicator which shows recent weekly lows losing momentum. The current downtrend in the EURAUD looks as if its days are numbered.
No need to investigate further with the daily chart. That can be looked at later as the pattern of trading starts to suggest a low may be at hand. For now, it’s time to put the hard hat on and gear up for potential mission commencement shortly.
Bio
I have studied charts for over 20 years and currently am a private trader. Several years ago I worked as a licensed advisor with a well known Australian stock broker. While there was an abundance of fundamental analysts there seemed to be a dearth of technical analysts, at least ones that had a reasonable idea of things. So my aim here is to provide my view of technical analysis that is both intriguing and misunderstood by many. I like to refer to it as the black magic of stock market analysis.
Please register your interest in my website coming soon. Any questions or suggestions, please contact austingalt@hotmail.com
© 2014 Copyright Austin Galt - All Rights Reserved
Disclaimer: The above is a matter of opinion provided for general information purposes only and is not intended as investment advice. Information and analysis above are derived from sources and utilising methods believed to be reliable, but we cannot accept responsibility for any losses you may incur as a result of this analysis. Individuals should consult with their personal financial advisors.
© 2005-2022 http://www.MarketOracle.co.uk - The Market Oracle is a FREE Daily Financial Markets Analysis & Forecasting online publication.


