


Commodities Market Wrap - Gold, Silver, Oil and Mining Stocks
Commodities / Gold & Silver Mar 06, 2007 - 12:41 AM GMTBy: Douglas_V_Gnazzo

The latest buzz is that the commodity bull is over, sighing its last breath of life. Someone forgot to tell China the story, as last week they imported more copper then at any time since June 2005.
Cattle prices in Chicago surged to their highest level since 2003, and hog futures also rose. Sugar also put in a good week's showing.
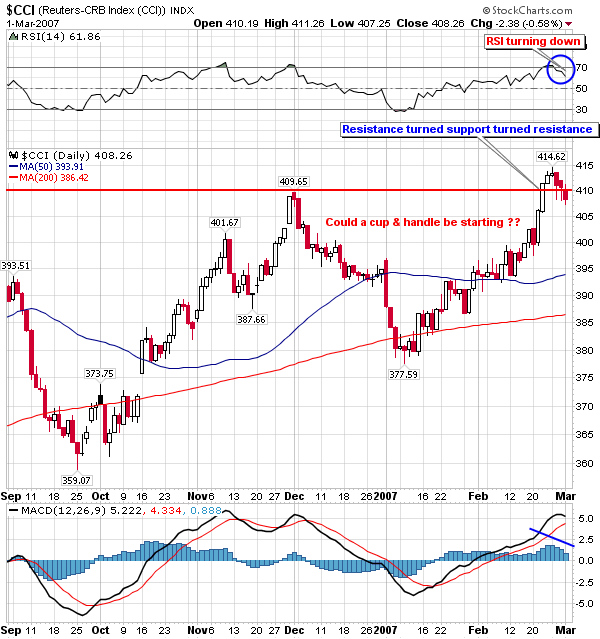
Most analysts tout the CRB Index as proof positive that the commodity bull is dead and gone. The CRB is a weighted index, with oil and other commodities receiving a heavy overall weighting, which skews the reliability of the index to provide a true picture of the commodity sector in general.
Below is a chart of the CCI Index, which is an equally weighted index of commodities. Each commodity has the same weighting as any other commodity. Thus, a much clearer and truer picture of the commodity sector is revealed.
The chart proceeds from the bottom left hand corner to the upper right hand corner - a bullish signature. Prices have just barely corrected down. There is also a potential cup with a handle formation that may be in the progress of forming, which is one of the strongest chart patterns existent. The chart bears watching.
Energy
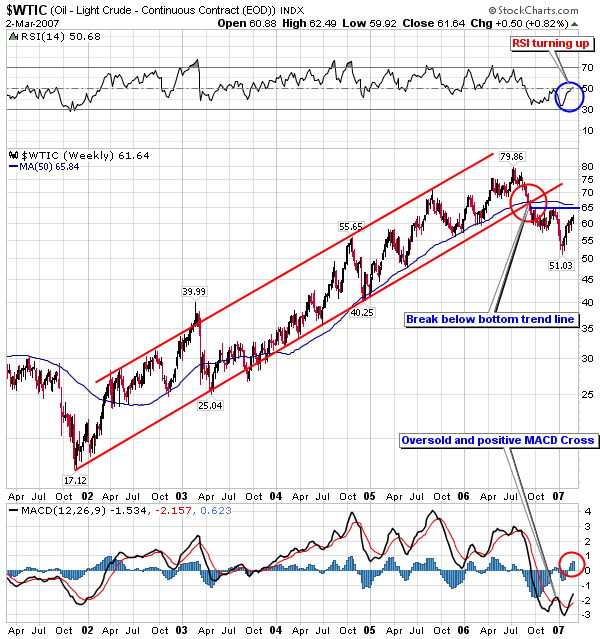
Crude oil lost .50 cents, or 0.82% (continuous contract), to close at $61.64 a barrel. The chart below shows crude breaking below its previously rising channel.
To begin to consider a return to the bullish scenario, oil would have to rally back inside its channel. Presently RSI is rising and a bullish MACD cross over has occurred.
Although investors that are long oil would like to see it rise in price, it is better for the economy and the average person if it does not increase, as rising prices hit hard at the consumer's bottom line, via heating oil and gas for transportation.
Natural Gas
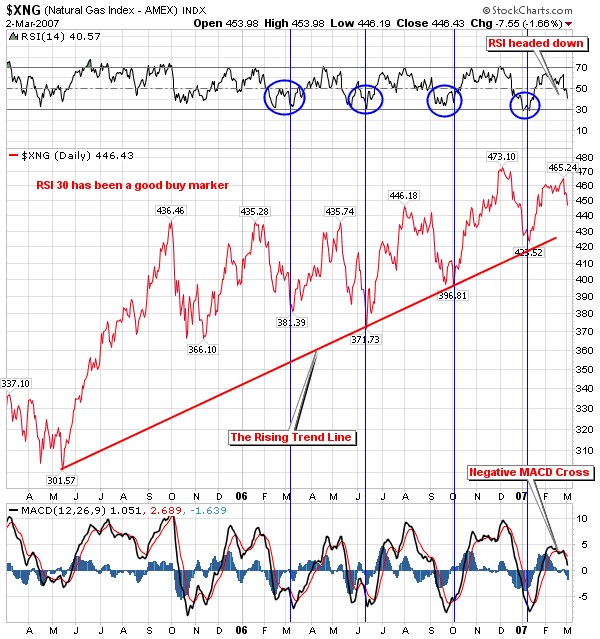
The Energy Department reported that U.S. gas stockpiles fell 132 billion cubic feet last week, which represents a 12% surplus over and above the 5 year average supply level.
The chart below of the XNG Natural Gas Index shows the RSI readings consistent with past bottom formations just prior to significant rallies up. Note that RSI is presently headed down, and that the MACD indicator has just put in a negative cross over.
However, charts look most bearish just before they turn bullish, and they look most bullish just before they turn bearish. We are long term bullish on both oil and gas.
Gold
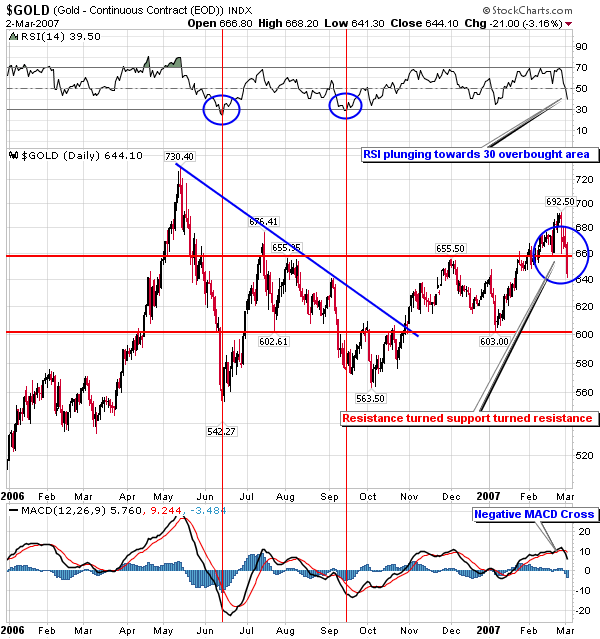
Gold had a tough week, losing $21.00 to $644.10 (continuous contract) for a loss of -3.16%. It was gold's lowest weekly close since January 19, 2007. It is down $45.70 from its recent high of $689.80 or 6.6%.
Up first is the daily chart of gold, which shows it breaking below support that had just gone from resistance to support, and now is resistance once again. Volatility reigns supreme. We expect such to continue.
Note the RSI levels that have coincided with past lows from which significant rallies began. RSI appears headed down towards such levels (30). Also, note that the MACD indicator has just registered a negative cross over.
A good deal of overhead supply and resistance remains to be worked off. It will not occur overnight. Patience is the password.
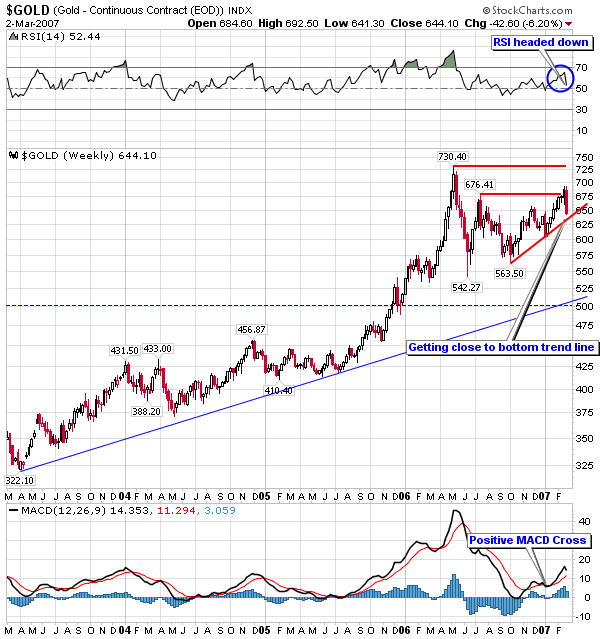
Next is the weekly chart of gold. It is more positive then the daily. RSI is headed down, however, the MACD indicator has just made a positive cross over.
The weekly closing price broke above resistance, to once again return below it, and is approaching its bottom trend line support. All we can say is it's a bull market until it isn't - and as of now it is.
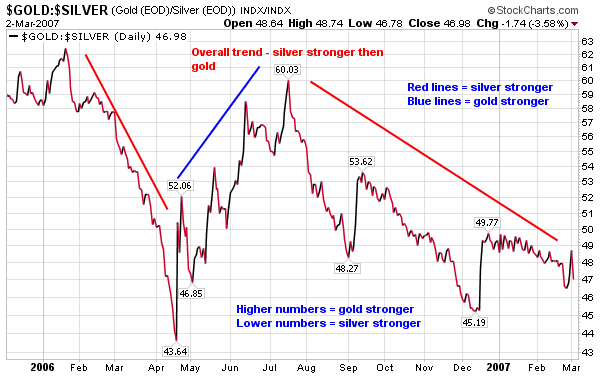
Below is a chart comparing the performance of gold to silver. As the chart indicates, silver has been handily outperforming gold. This is generally construed as an overall negative for the precious metals. We say maybe - maybe not.
We have been invested in both and are quite satisfied with the returns offered. Also, silver stocks have been on fire, and have appreciated appreciably to say the least. For those who said silver would not perform well, they just missed one heck of a rally by the silver stocks.
Some analysts refer to silver as the "bitchy" metal. We care not if it is or isn't - we only care about being on the right side of the trade. It can ***** all it wants to if it keeps going up in price.
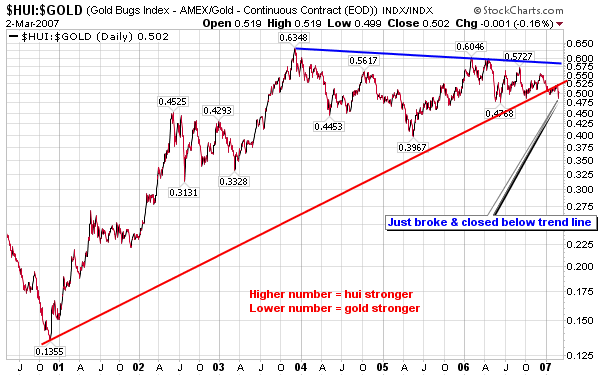
Next we have the chart of the Hui/Gold ratio. This chart compares the performance of the precious metal stocks in the Hui Index to the physical metal.
Generally, conventional consensus considers that the stronger the performance is by the gold stocks versus the metal, the better it is for the overall performance of the entire precious metals market sector.
The chart shows the ratio just breaking below its bottom support line, indicating that the gold stocks are under performing the physical metal.
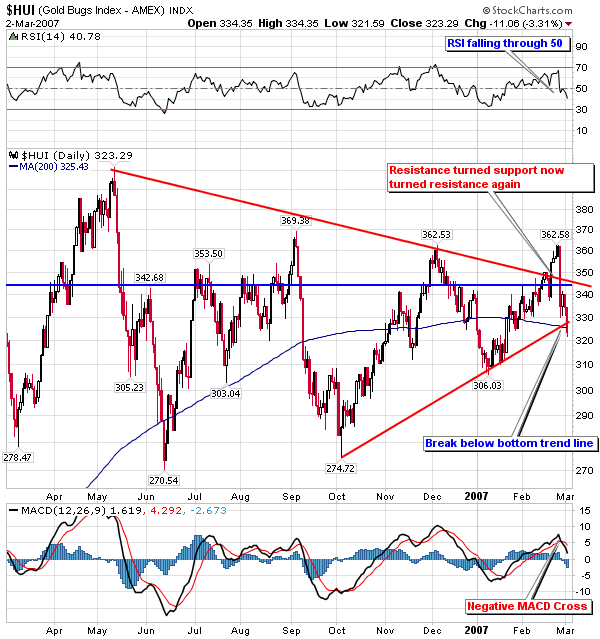
Next we have the daily chart of the Hui Index. All markers on the chart have turned negative after last week's mauling. What had been resistance turned support has now returned to be resistance once again.
RSI is headed down, and the MACD indicator is flashing a negative cross over. Lastly, the price action has broken below the bottom support line, and just below its 200 ma. Much work on the existing overhead supply needs to be done.
Once again - it is not going to happen overnight. The market is transferring "stuff" from weak hands to strong hands. You place your money down and you take your chances.
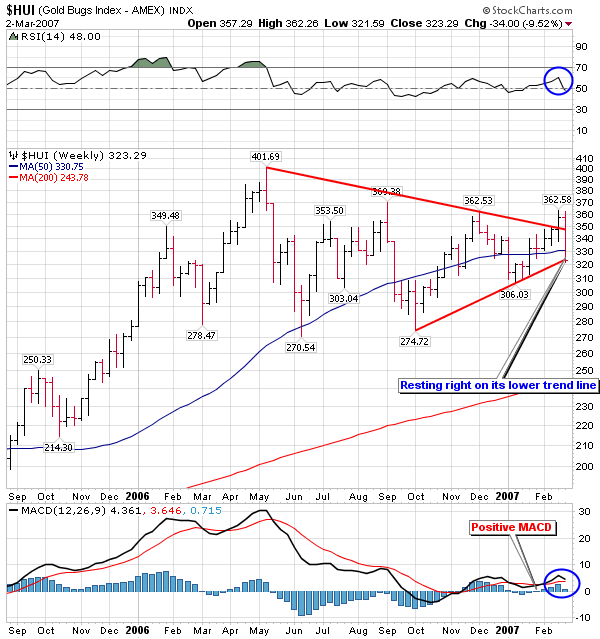
Now we have the weekly chart of the Hui Index. It presently is sitting right on its lower support line. RSI is headed down, however, the MACD has recently flashed a positive cross over. The signals are therefore - mixed.
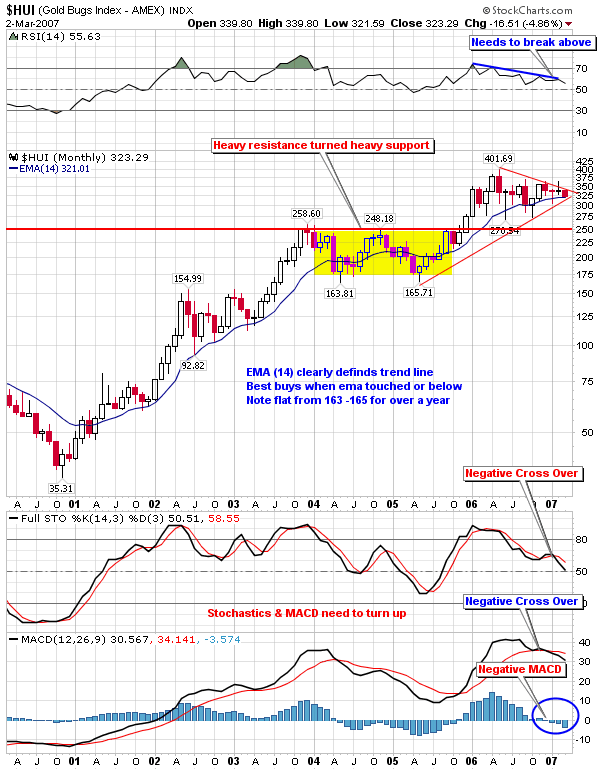
Next up is the monthly chart of the Hui Index. It shows a recent negative MACD cross over and RSI is headed down and needs to turn back up.
A symmetrical triangle is once again compressing the price action. Volatility seems to be the order of the day. The yellow zones are heavy-duty support zones.
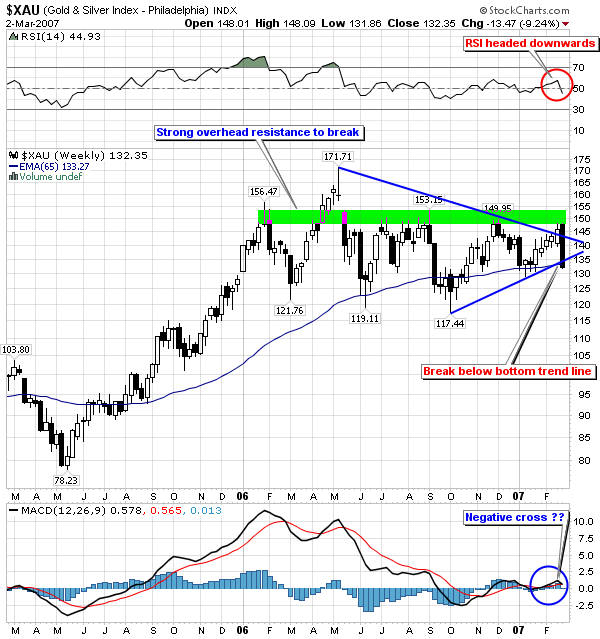
The chart of the XAU Index pretty much shows the same thing as the Hui. The price has just barely broken below the bottom of its symmetrical triangle.
Indicators are mostly negative. Strong overhead supply and resistance resides at 150.
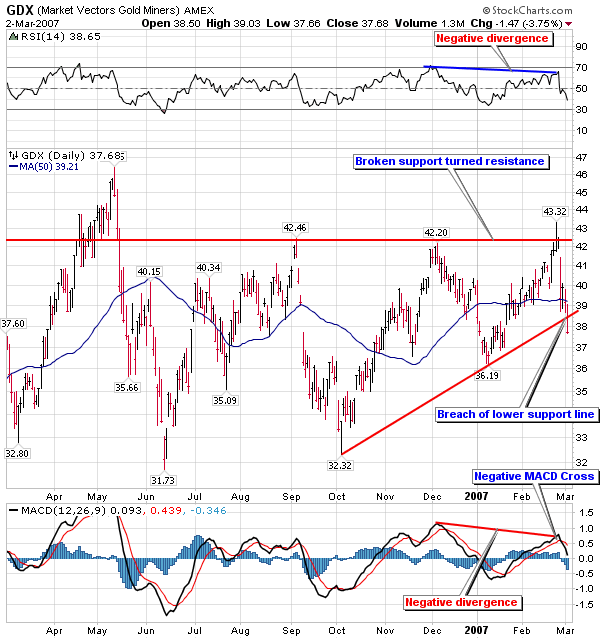
Next up is the GDX Index. It is the most negative of all the pm stock indexes. All indicators are negative and require significant work to repair. We are of the opinion that such will occur, but as we said it will not happen overnight.
The chart is self-explanatory and requires no further elucidation.
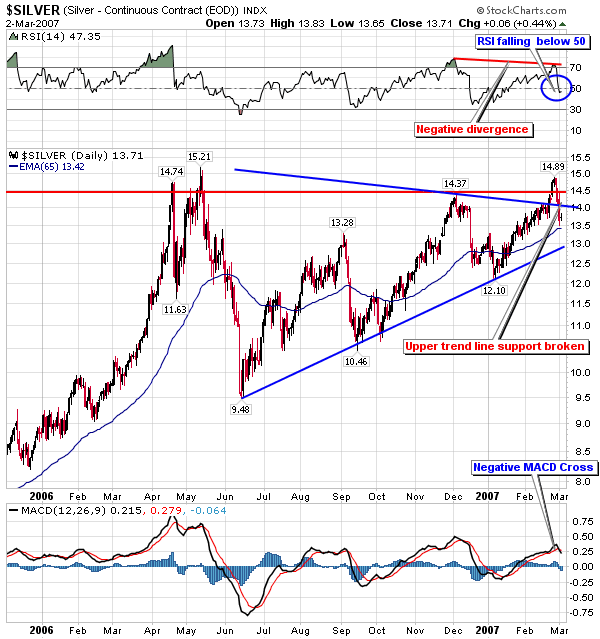
Silver
As did gold - silver also had a tough week, losing $1.03 to close out at $13.71 for a loss of 7%. Silver out performed on the upside, so it has more to give back on the downside.
It was silver's lowest weekly close since February 2, 2007. Silver is down 9% from its high.
The daily chart shows negative divergence with both RSI and MACD. An upper trend line break has occurred as well. There is much work to be done.
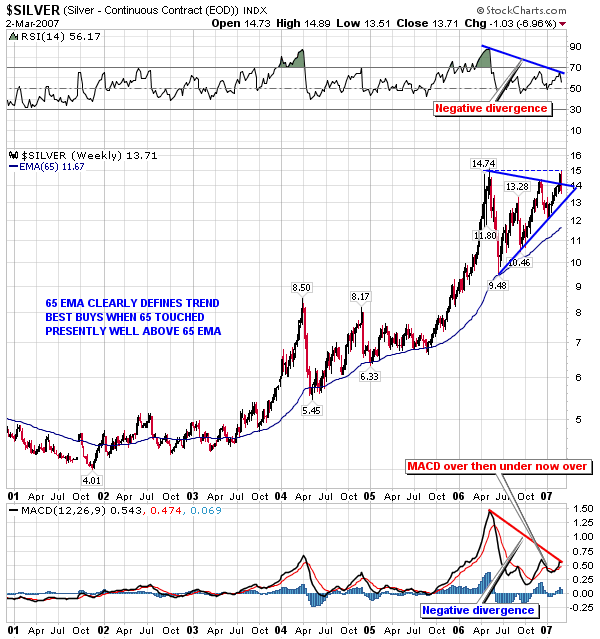
The weekly chart also has negative divergences, however, its price action is closer to the top of its formation than to the bottom.
The divergences suggest that more downside action will most likely occur prior to a sustainable rally.
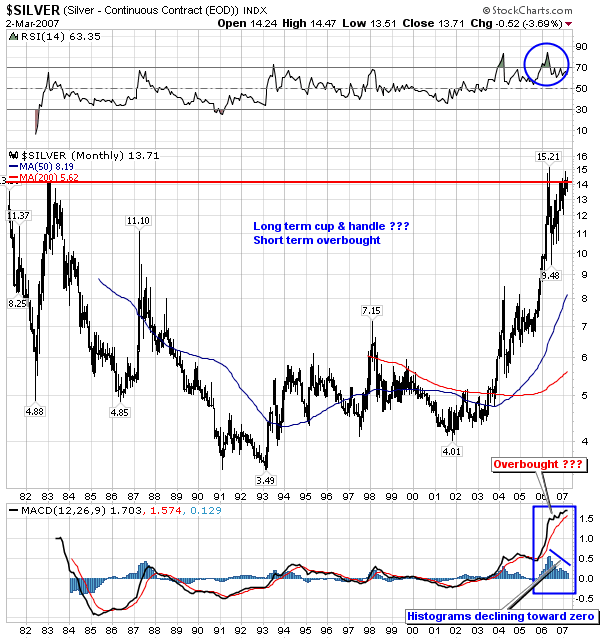
The monthly chart of silver shows overbought readings with the histograms declining back towards zero.
However, the overall chart formation looks like a very large cup and handle formation, which if it is - will be very powerful when it launches from the "rim".
The longer a cup and handle formation takes to form - the more powerful it is when it breaks to the upside. This one's been forming for 25 years. Stock up on popcorn?
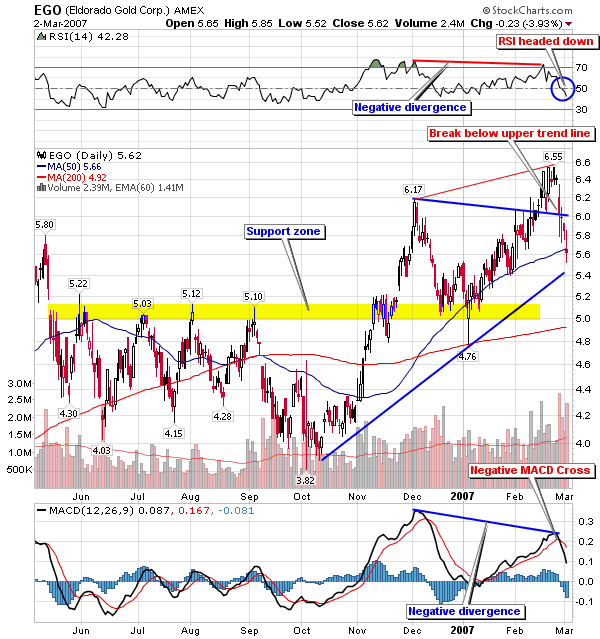
Eldorado Gold
Eldorado Gold has a chart that says: we don't want to buy any. We have owned it several times and just recently sold it for a good profit. Note the negative divergences that are playing out in the price action.
Positive and negative divergences can be powerful markers of future price action. As with any indicator they can give false signals and fail, however, when they do pan out - they literally do pan out.
The chart illustrates some indicators to be weary of, and to stay away from a stock that is sporting them.
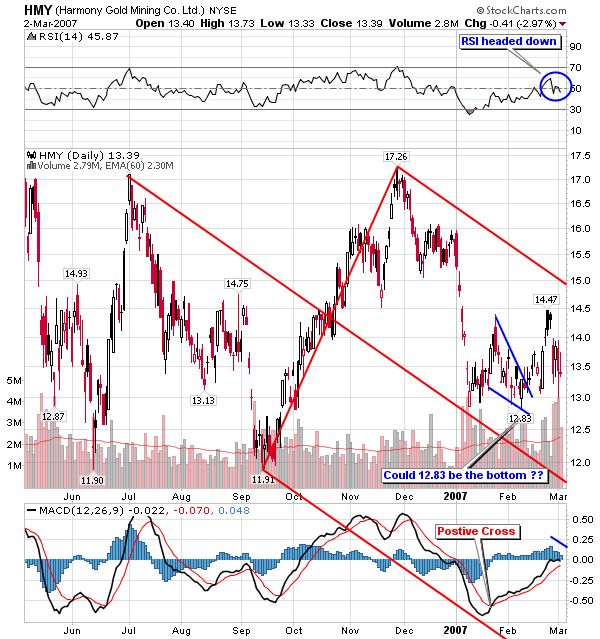
Harmony Gold
Harmony Gold has been very good to us. We have been in and out many times - going back to the low single numbers. Yet we believe the best is yet to come. We own a fair amount of the stock.
As with just about any of the precious metal stocks, harmony is under pressure. We plan on accumulating more on any lows that hold right above $12.83. An intra-day spike down with a reversal is just what the doctor has ordered; the question is: will the fates comply.
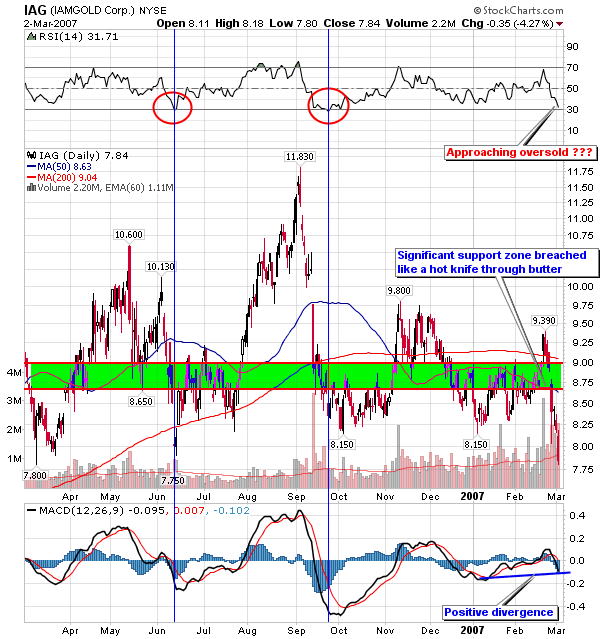
I Am Gold
We presently own the stock, and its price action has piqued our interest. There are a couple of positive divergences occurring, and RSI is approaching the level from which past rallies have started. No guarantees - but it does look interesting, at least to us. But we are easily entertained.
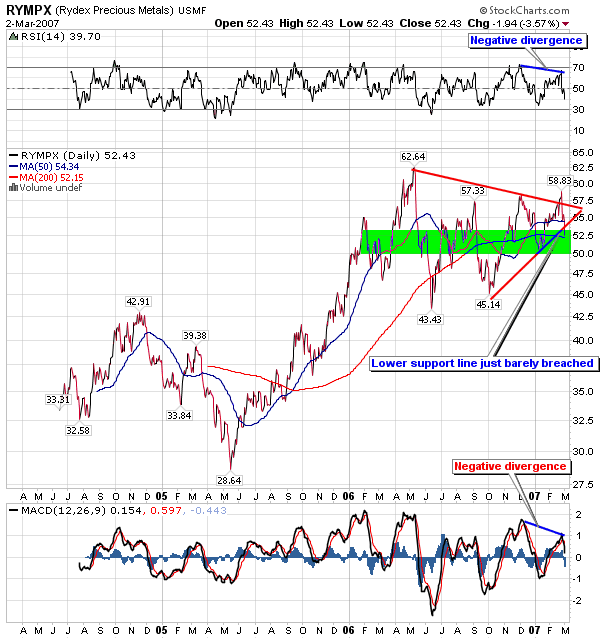
Rydex Precious Metals
We tentatively plan on taking a fairly large position in this fund; however, the time has not yet come. Several negative divergences are occurring, and it has just ever so slightly breached its bottom trend line to the downside.
We are waiting for the divergences to correct and the price action to break out and upward. If we do take a position, it will be in accumulated in four (4) incremental and separate buys. Scaling into positions makes up for timing mistakes by cost averaging the position out.
All of our positions are accumulated very incrementally. We try to buy into weakness and sell into strength. We prefer intermediate term plays, but we will take whatever the market offers.
We like Rydex because they have several other "unique" funds that we like trading, such as the reverse stock, bond, and dollar funds.
In the not too distant future we are of the opinion that bonds are going to be a big big play to the downside.
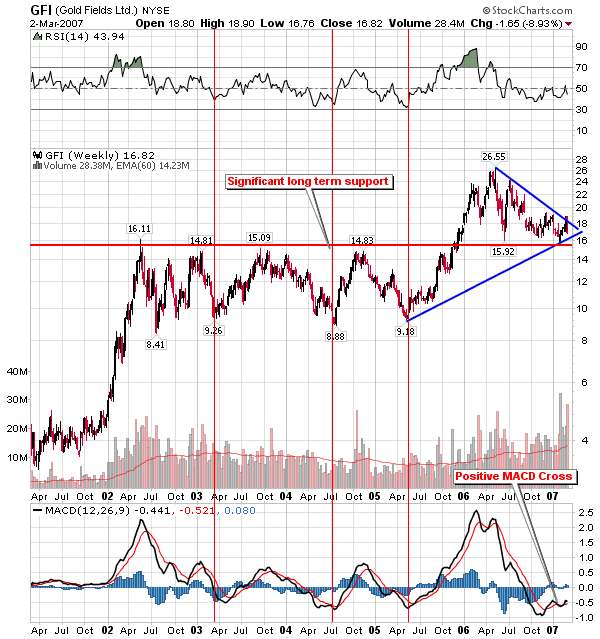
Gold Fields
Gold Fields like harmony has been good to us. We have owned it several times. We presently own a good chunk of it, and may accumulate more on weakness.
As the chart shows, there is serious and significant support right around the $15 dollar level. This support goes back 5 years and took 5 long-term rallies until resistance turned to support.
We look for good things from GFI.
By Douglas V. Gnazzo
Honest Money Gold & Silver Report
Douglas V. Gnazzo is the retired CEO of New England Renovation LLC, a historical restoration contractor that specialized in the restoration of older buildings and vintage historic landmarks. Mr. Gnazzo writes for numerous websites, and his work appears both here and abroad. Just recently, he was honored by being chosen as a Foundation Scholar for the Foundation of Monetary Education (FAME).
Disclaimer: The contents of this article represent the opinions of Douglas V. Gnazzo. Nothing contained herein is intended as investment advice or recommendations for specific investment decisions, and you should not rely on it as such. Douglas V. Gnazzo is not a registered investment advisor. Information and analysis above are derived from sources and using methods believed to be reliable, but Douglas. V. Gnazzo cannot accept responsibility for any trading losses you may incur as a result of your reliance on this analysis and will not be held liable for the consequence of reliance upon any opinion or statement contained herein or any omission. Individuals should consult with their broker and personal financial advisors before engaging in any trading activities. Do your own due diligence regarding personal investment decisions. This article may contain information that is confidential and/or protected by law. The purpose of this article is intended to be used as an educational discussion of the issues involved. Douglas V. Gnazzo is not a lawyer or a legal scholar. Information and analysis derived from the quoted sources are believed to be reliable and are offered in good faith. Only a highly trained and certified and registered legal professional should be regarded as an authority on the issues involved; and all those seeking such an authoritative opinion should do their own due diligence and seek out the advice of a legal professional. Lastly, Douglas V. Gnazzo believes that The United States of America is the greatest country on Earth, but that it can yet become greater. This article is written to help facilitate that greater becoming. God Bless America.
© 2005-2022 http://www.MarketOracle.co.uk - The Market Oracle is a FREE Daily Financial Markets Analysis & Forecasting online publication.