65,000 U.S. Marines Hold up a Mirror to the Economy
Economics / US Economy Aug 26, 2014 - 05:36 PM GMTBy: Don_Miller
 I was 18 years old when I left boot camp for Camp Lejeune, North Carolina, where the Marine Corps stationed 65,000 troops. When my unit got our first weekend pass and could actually leave the base in civilian clothes, something I hadn’t worn in several months, I put on a brand new pair of Levis, no belt, penny loafers, white socks, and a collared, buttoned shirt. I had no hair to comb—the Marine Corps saw to that.
My take home pay was less than $50/month, so my entertainment options were limited. My friends and I got on a bus headed for the nearest town: Jacksonville, North Carolina. We soon realized Jacksonville was full of the same people we saw on base all week. We weren’t old enough to drink, so the local bar was out. My high school friend Paul and I had enlisted together and proclaimed, “We’re 65,000 marines all dressed up with no place to go!”
It’s funny how some memories are still vivid 55 years later. This summer a friend asked why the stock market was doing so well while the economy is doing so poorly. Without thinking, I answered, “We’re all dressed up with no place to go.”
Are we in a bull market or a bear market?
Let’s start with basic definitions, courtesy of my online dictionary:
- Bull market—A period of generally rising prices. The start of a bull market is marked by widespread pessimism. This is the point when the crowd is the most bearish. The feeling of despondency then changes to hope, optimism, and eventually euphoria.
- Bear market—A general decline in the stock market over a period of time. It is a transition from high investor optimism to widespread investor fear and pessimism.
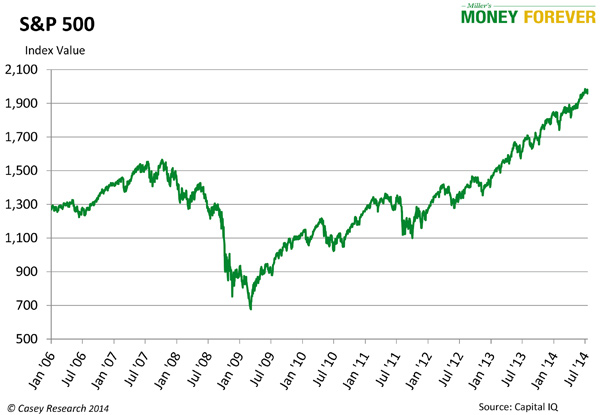
Take a look at the chart below tracking the S&P 500 from January 2006 to July 2014.

The chart makes it seem as though the pessimism of the 2008 crash is behind us. Stock prices are now at an all-time high (unadjusted for inflation).
So, is it a bull or a bear? The bull markets of the past coincided with boom times: employment was high and there was that feeling of optimism and euphoria. But where’s the hope, optimism, and euphoria now?
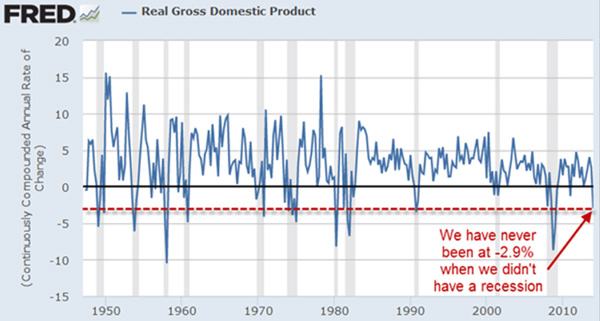
Yes, we see some characteristics of a bull market, but look at real gross domestic product from 1950 onward in the chart below and a growling bear may appear in your mind’s eye.

That’s right: we’ve never been at -2.9% outside of a recession. In other words, it’s neither a bull nor a bear, as market performance isn’t synchronizing with real gross domestic product.
Bud Conrad, one of my colleagues at Casey Research, offered a grim analysis of the chart above immediately after the Q1 data was published:
The above is based on the annual change in GDP; quarterly readings are more sensitive and volatile. Still, it’s worth noting that Q1 GDP growth came in at -2.9%—an awful number that suggests we’re dangerously close to a recession (the official definition of a recession is two consecutive quarters of GDP contraction).
First-quarter numbers have since been revised to -2.1% year-on-year, and Q2 came in at +4% year-on-year. That’s good, but it’s difficult to see an uptrend yet, given the negative shift over the first quarter.
Frightening Unemployment
Part of the Federal Reserve’s mandate is to promote maximum employment. How well is that going?
The Bureau of Labor Statistics (BLS) reports a national, seasonally adjusted unemployment rate of 6.1% for June 2014. 6.1% isn’t the whole story, though. As James Rickards noted in a post for the Darien Times, although 288,000 jobs were created in June, the number of full-time jobs dropped by 523,000. The widely reported increase is the result of 800,000 new part-time jobs.
As Rickards notes, the increase in part-time employment will likely continue, driven in part by Obamacare’s coverage requirements for full-time employees. This statistics charade is not breeding optimism and euphoria.
Meanwhile, unemployment inched up to 6.2% in July.
Why Are We Seeing Horns?
If the economy is struggling, why does the stock market look bullish?
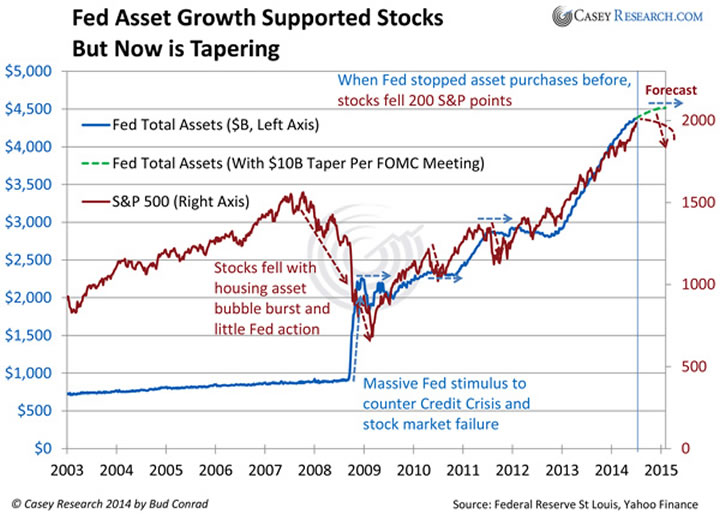
Bud Conrad shared a telling graphic with my team to help answer that question.

The Fed is flooding the system with money. That money is propping up the stock market. When the Fed tries to put the brakes on the stimulus, the stock market abruptly turns down. What happens if the Fed decides to change course and stop buying government debt and/or raises interest rates? Will the bubble burst?
A New Breed of Problem
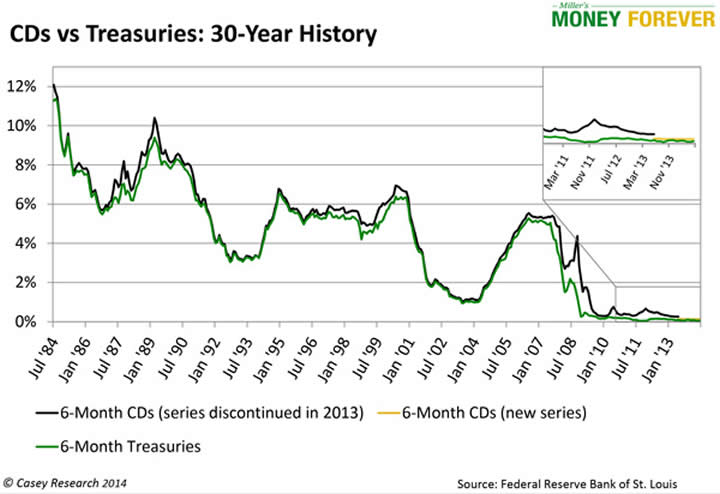
If a correction is inevitable, why not pull out of the market and wait? The short story is, there’s nowhere else to go. There are no solid fixed-income investments.
The chart below sums up the story neatly. It shows 6-month CDs and 6-month Treasuries, but the trend is the same for all fixed-income investments over this 30-year period. We enlarged the final period shown in the chart so that you wouldn’t have to strain your eyes to see the yellow line representing new series 6-month CDs.

The stock market may look good on paper, but prices are generally higher than the fundamentals justify. Eventually a correction will occur. Here’s what I see happening:
- The economy is sending mixed signals. We may be in a recession already; however, no official will say that until after the election.
- Consumers are not spending despite some of the good incentives to do so. Baby boomers are concerned about their retirement and holding their wallets tight. When pessimistic about the economy, spenders cut back on wherever they can.
- Government-reported data is questionable at best—massaged for political purposes. Use it accordingly.
- There are no safe fixed-income investments available that will keep up with inflation. A decade ago you could have sold your stocks and upped your positions in inflation-beating, high-quality bonds. Not today. The Fed has indicated they are going to keep interest rates low for quite some time.
We have a bull-like market because of government policies, not because of solid fundamentals. I am not the guy standing on the street corner holding a sign saying, “Repent, the end is nigh.” But I don’t know how much longer things can continue in limbo.
Waiting for the Return of Fundamentals
As we wait for the market to start trading on fundamentals again, be nimble. That means avoiding long-term commitments. Make sure you can get out of any position quickly.
US investors also need to step a bit further out of their comfort zone. The market capitalization of public companies incorporated in the US is approximately 34% of the world’s total market capitalization, but US investors have 72% of their assets invested in their home country on average.
I shudder when readers mention how many eggs they have in their home country’s basket. I encourage all investors to review their holdings and diversify internationally.
As we wait for things to shake out, keep yourself current on economic change and the best investment strategies for retiring rich in any environment by signing up for my free weekly e-letter, Miller’s Money Weekly.
Disclaimer: The above is a matter of opinion provided for general information purposes only and is not intended as investment advice. Information and analysis above are derived from sources and utilising methods believed to be reliable, but we cannot accept responsibility for any losses you may incur as a result of this analysis. Individuals should consult with their personal financial advisors.
Casey Research Archive |
© 2005-2022 http://www.MarketOracle.co.uk - The Market Oracle is a FREE Daily Financial Markets Analysis & Forecasting online publication.


