Real U.S. Interest Rates and Future Chaos
Interest-Rates / US Interest Rates Sep 07, 2014 - 06:04 PM GMTBy: John_Rubino
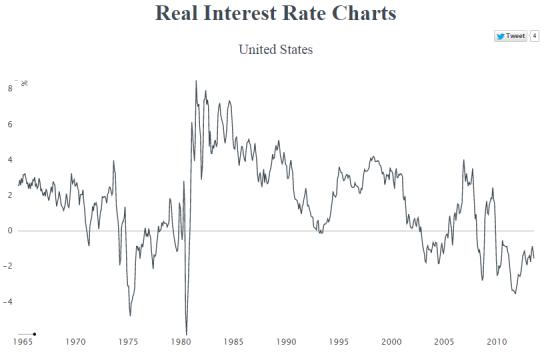
The folks at Gresham’s Law just published a nifty interactive chart of real (i.e., inflation-adjusted) interest rates since the 1960s that explains a lot about today’s world.

To make sense of this, let’s start with a a little background: Interest rates are the rental cost of money, but to figure out the true cost you have to adjust the nominal (or numerical) interest rate for inflation, which is the rate at which the currency being borrowed is falling in value.
If the nominal interest rate is higher than inflation, then the real interest rate is positive. If the real rate is both positive and high, that’s a signal that money is expensive and that one is better off being a lender (to reap those high returns) than a borrower (who has to pay the high true cost of money). The opposite is true for negative real rates, where the nominal cost of money is lower than the rate at which the currency is being depreciated. In this case a borrower actually gets paid to borrow because the true cost of the loan falls as the currency loses value. So negative real rates tell market participants to borrow as much as possible.
Given these incentives one might expect the following:
1) Slightly positive real rates should be the norm in a properly-functioning economy, since that’s the way a healthy market works for most other things, where sellers reap a reasonable real profit and buyers pay a manageable price.
2) Periods of very high real rates should cause borrowing to plummet and economic growth to slow.
3) Periods of sharply negative real rates should produce a burst of borrowing that leads to booms, either in hot asset classes or across the board. As Automatic Earth’s Raúl Ilargi Meijer put it just this morning:
The simple truth about ultra low interest rates is so simple it’s embarrassing, at least for those who claim they benefit society. That is, ultra low rates make borrowing accessible to the wrong people, and to the right people for the wrong reasons. The former are people who shouldn’t be able to borrow a dime, because they have no credit credibility, the latter borrow only for unproductive or counter-productive reasons.
The above chart bears all this out. Back in the 1960s when growth was relatively steady and the dollar was still linked to gold, real interest rates fluctuated between one and three percent. But after the US broke the link between the dollar and gold in 1971 and embarked on its epic debt binge, real interest rates started to gyrate. They plunged to -5% in 1975, leading to an inflation spike and dollar crisis a few years later. They then jumped to 8%, producing the severe recession of 1982. They fell to zero in 1994, setting off the tech stock bubble, and turned negative in 2004, inflating the housing bubble. Then they spiked, producing the Great Recession.
Since the 2008 crisis the real rate of interest has been mostly negative, which accounts for the global boom in real assets. For someone with access to borrowed money it now makes sense to use it to buy fine art, trophy real estate, farmland, and other things that governments can’t create more of. All of these things are in raging bull markets, implying that the smart money is responding to negative interest rates exactly as you’d expect.
So what now? History as depicted here says the borrowing binge/asset bubble continues until real rates spike, either because nominal rates soar or inflation plummets. It also implies that the phase change, when it comes, will be sudden. Looking at 1975, 1980 and the volatility since 2007, it’s clear that a financial system based on fiat currencies is inherently unstable — i.e., incapable of finding a stable price for money. So the least likely scenario is a return to a nice, placid world of “normal” interest rates.
By John Rubino
Copyright 2014 © John Rubino - All Rights Reserved
Disclaimer: The above is a matter of opinion provided for general information purposes only and is not intended as investment advice. Information and analysis above are derived from sources and utilising methods believed to be reliable, but we cannot accept responsibility for any losses you may incur as a result of this analysis. Individuals should consult with their personal financial advisors.
© 2005-2022 http://www.MarketOracle.co.uk - The Market Oracle is a FREE Daily Financial Markets Analysis & Forecasting online publication.


