


A Closer Look at the US Dollar
Currencies / US Dollar Sep 15, 2014 - 05:52 PM GMTBy: Gary_Tanashian

 Using the standard weekly currency chart we followed along for months as the Euro found resistance at the long-term downtrend line as expected, the commodity currencies long ago lost major support and non-confirmed the commodity complex and the US dollar moved from a hold of critical support, to a trend line breakout, to its current impulsive and over bought status. It is time now for a closer look at Uncle Buck since this reserve currency is key to so many asset markets the world over.
As the charts below show, USD is over bought on both daily and weekly time frames. But the monthly is interesting because its big picture view is that of a basing/bottoming pattern, and it is bullish. That is a long-term director, so regardless of what happens in the short-term, a process of unwinding the hyper-inflationist ‘Dollar Collapse’ cult is ongoing. Signs point to disinflation toward deflation.
We’ll start with a daily chart and then ascend right through the weekly and then the monthly to take the pulse of USD.
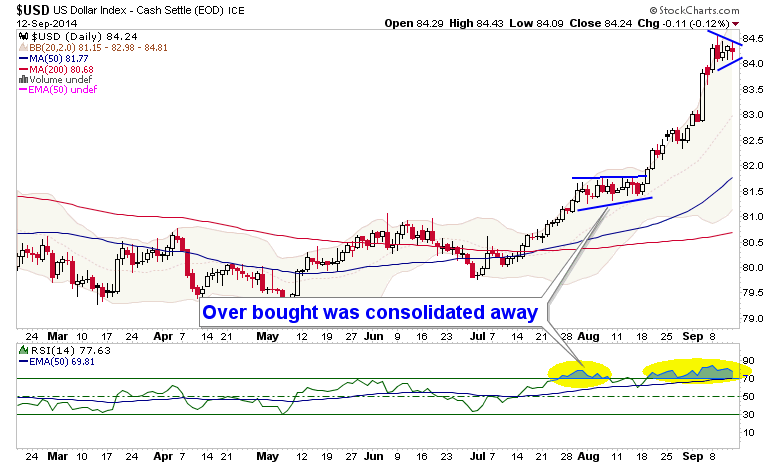
As noted, the daily chart below is very over bought. It is currently consolidating the big jerk upward that has come against Euro-negative policy from the ECB and an increasing drum beat about an eventual rise in the Fed Funds rate in the US. People are finally catching on to the fact that the US economy has been strengthening since early 2013 and that the Fed is looking out of touch holding ZIRP despite this strength.
So the dollar is getting bid up. The question the chart asks is whether the current consolidation will work-off of another over bought situation, or is a prelude to a reversal? The answer is going to be key to the bounce potential in many asset markets, but especially commodities, which are generally tanking and precious metals, with gold eventually due to firm after it finishes its bear market and its fundamentals come in line.
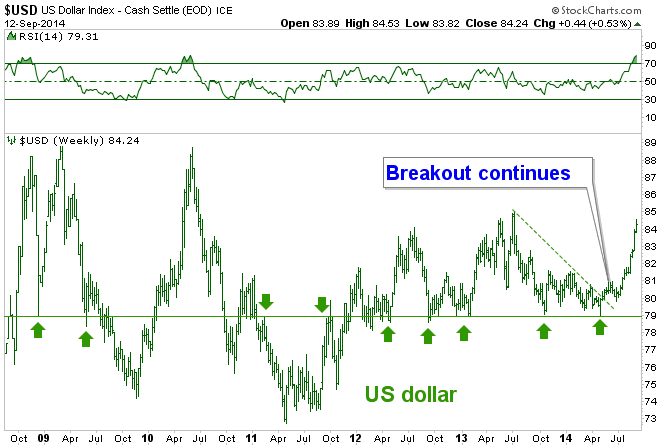
You will recognize the weekly chart as it is the top panel of our long-running multi-currency chart. RSI has been added to this view to show the over bought level. Note that the weekly has joined the daily in over bought status on this most recent drive, whereas it was merely healthy – and not over bought – the last time the daily registered an over bought reading in July.
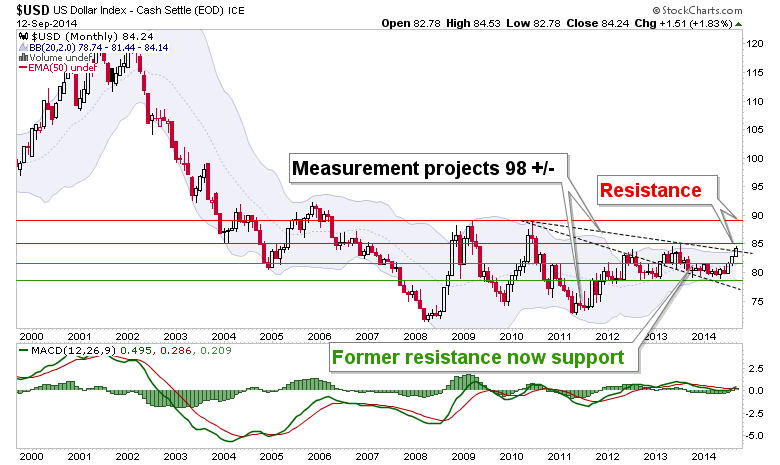
The monthly chart directs the big picture. An eventual upside target of 98 is indicated by measuring the pattern’s depth. Adding credence to the idea that today’s over bought status is different from the one in July (ref. daily chart above) and that USD can take a routine correction is that this time there is significant upside resistance at around 85. The previous daily over bought had no such monthly resistance.
USD & Macro Implications
The macro plan has not changed. It is not complete by any means, but components of it seem to be in progress. That plan includes an eventual economic deceleration and conveniently enough, while a strong USD can pull global capital into the US like a well tuned Dyson (Hoover for old school domestic engineers), it may start to erode US business activity.
Specifically, future ISM reports for example, will be very interesting. Manufacturing likes a weaker dollar. They may have repealed many laws of economics (or maybe just delayed them), but I have a feeling this one will endure.
In the financial sphere things are more complicated. As global funds seek to get themselves denominated and/or invested in USD, large (too big to fail) financial entities – the US’ greatest industry after all – can benefit longer than some factory selling widgets to European customers.
Bottom Line
For 19 months now we have been noting first the potential for economic strength (with the Semiconductor equipment ramp up) and then the realization and persistence of that strength. The strength in Uncle Buck is at least in large part a reflection of that.
If just one traditional market signal holds to its historical modus operandi, that strength would eventually wear at the economy as an angry Uncle Buck, so reviled for so long as an anti-market to ongoing asset market parties* reclaims his territory.
Meanwhile, USD is at risk of a correction if it cannot work off the daily and weekly over bought status in a calm manner as it did in August. In that event, assets could bounce with the implication of commodities and precious metals getting counter trend rallies and stocks continuing upward.
If on the other hand USD works off the over bought with another consolidation, the trend is up in all time frames and some pretty big upside could follow. The daily chart will instruct so while we will continue to monitor the major currency group from weekly and monthly perspectives, consider Uncle Buck on radar for more intensive short-term management going forward.
* Recall how impressive the rolling commodity speculations featuring USD as a counter-party were; Uranium and China in 2007, Crude Oil and Copper in 2008, Silver and in my opinion to a lesser extent, Gold in 2011 (that event was driven largely by the Euro).
Subscribe to NFTRH Premium for your 25-35 page weekly report, interim updates (including Key ETF charts) and NFTRH+ chart/trade ideas!
By Gary Tanashian
© 2014 Copyright Gary Tanashian - All Rights Reserved
Disclaimer: The above is a matter of opinion provided for general information purposes only and is not intended as investment advice. Information and analysis above are derived from sources and utilising methods believed to be reliable, but we cannot accept responsibility for any losses you may incur as a result of this analysis. Individuals should consult with their personal financial advisors.
© 2005-2022 http://www.MarketOracle.co.uk - The Market Oracle is a FREE Daily Financial Markets Analysis & Forecasting online publication.