


The Macro View and the Stock Market
Stock-Markets / Stock Markets 2014 Sep 23, 2014 - 10:06 AM GMTBy: Gary_Tanashian

 Last week we noted that Uncle Buck would be front and center in the analysis, not because the strength in the (anti-market) currency was not expected (it was), but because our big picture theme of an ongoing economic contraction had remained intact (ref: gold vs. commodities ratio) over the long-term.
It is important here to remember that NFTRH would only be on its big picture macro themes as long as indictors implied they are still viable. I will be damned if I will let us follow a Pied Piper off an ideological cliff, no matter what readers (including me) might want to hear. We must dedicate to know what is happening, not what our hopes, dreams, egos, etc. think or worse, hope will happen.
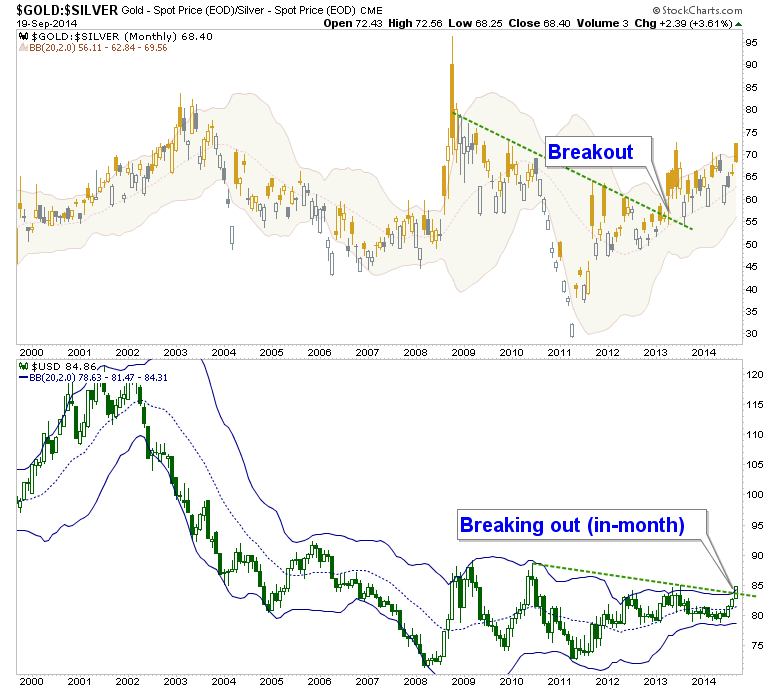
The correlation is loose but the monthly (big picture) patterns of the Gold-Silver ratio (GSR) and USD have generally been in alignment over time. We made a big deal about the GSR’s breakout last year as a macro signal, potentially bringing on a phase of weakness for equity markets (usually including gold stocks) and strength for the USD. Well, how long these events take to play out. The stock market has been just fine to date but USD, finally, is making its move to get in line with the GSR.
What would need to come next in the macro plan would be a follow-through in USD strength, the US economy fraying at the edges (manufacturing would be pressured by a persistently strong currency) and eventually stock market weakness, possibly leading to a bear market. So you can see that the picture is incomplete but may be in progress.
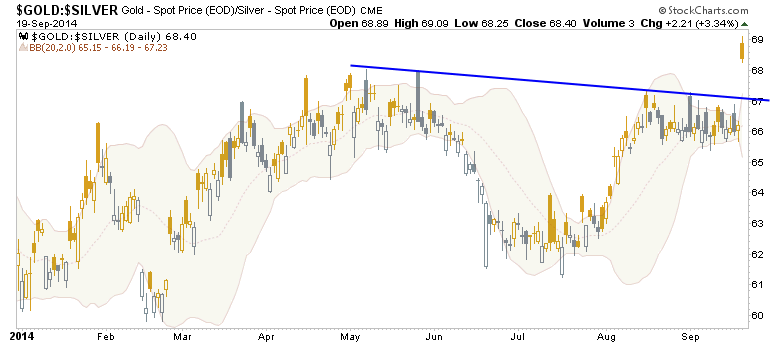
This is what the GSR did on Friday that caught my attention. The move looked impulsive as silver plummeted and it seemed a wake up call to asset markets.
Yet, another part of the macro plan and any future bullish view for gold, includes weakness in the US stock market, which has just not been happening outside of little ripples that barely qualify as corrections. US stocks are now quite over valued (though not in a bubble) by traditional metrics.
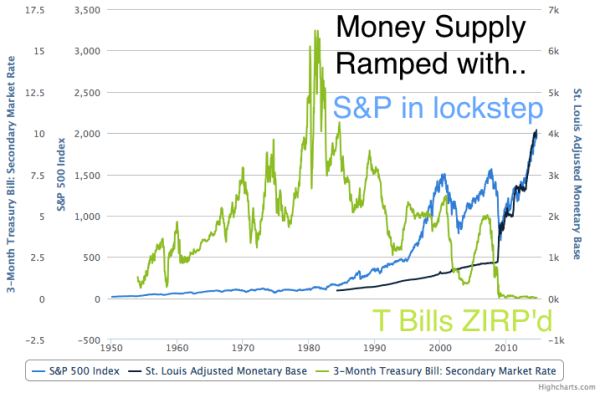
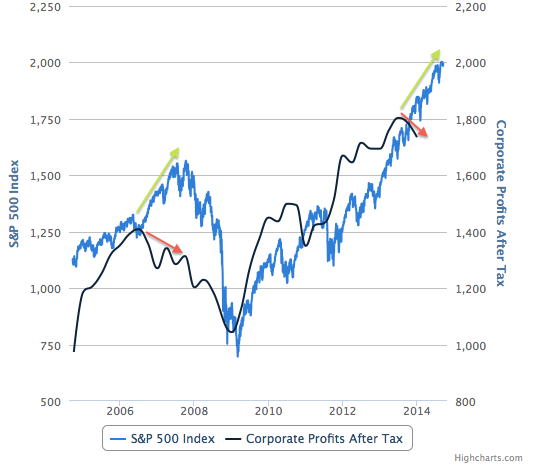
The bubble is in policy, not the stock market as the first chart below has made clear several times for us. The second chart shows the 10 year view of the S&P 500 vs. corporate profits. Profits are not yet in a negative trend, but in a negative divergence that bears watching as the market becomes over valued even by traditional metrics.
Source: SlopeCharts
Source: SlopeCharts
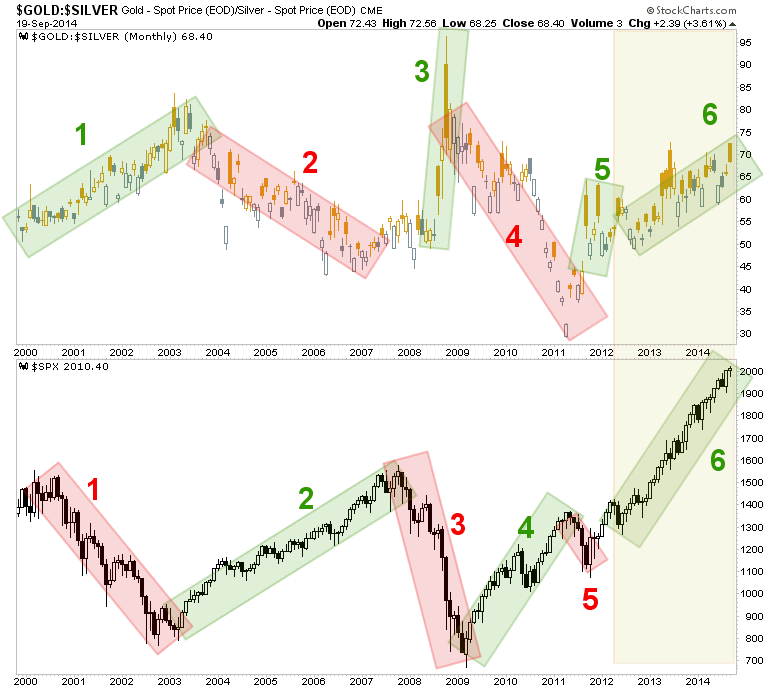
Returning to the GSR, we have a colorful monthly chart showing the GSR’s correlation to the S&P 500 over the last 1.5 decades. An indicator that has been reliable over the long-term has gone dysfunctional for the last 2 years as the SPX made the most impulsive leg of its journey upward despite a GSR that has ground upward as well.
Considering a potential drop off in corporate profits (here we remember that the manufacturing sector for one would not like a strong dollar) if the [impulsive] move in the GSR on the daily chart [above] is indicative of things to come, one would think US stocks would be vulnerable, considering that the USD is part of the move now.
Ah, but we have been here before. Dare to call this market at risk and you get served with a heaping helping of bull. So there is price and momentum to consider as well. But just as we have stated for so long that gold was at risk from a macro fundamental standpoint, we now state clearly that so too is the US stock market. It’s not me or my bias speaking, it’s the indicators and data, just a few of which are illustrated above.
We’ll conclude the segment with another negative view of market participation (joining the one shown for NDX/QQQ in the Key ETF update at the site last week). Similar setups in the recent past have led to minor or moderate corrections. Risks are gathering against the US stock market by this measure. Other indexes and sectors are showing similar divergence. Per Stockcharts.com: “The Participation Index (PI) measures short-term price trends and tracks the percentage of stocks pushing the upper or lower edge of a short-term price trend envelope.”
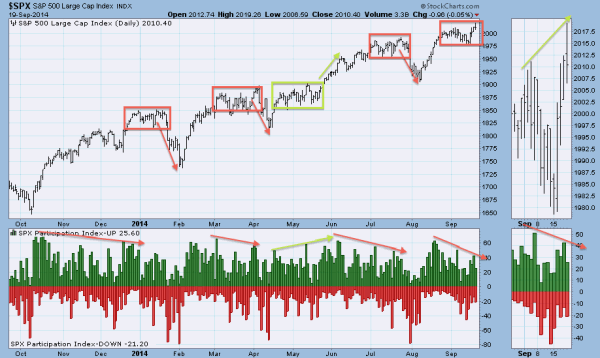
Consider this another warning on the stock market for a coming correction at least. Timing, if this is destined to resolve bearish, looks like the next several weeks to a month or so. Now, will the market play ball as the red boxes imply?
Bottom Line
The stock market has rendered certain individual indicators dysfunctional over the last 2 years. When several indicators start to gather toward similar conclusions, it is time to pay attention. Meanwhile, price momentum continues upward until it no longer does.
In much the same way we have noted gold’s macro fundamentals are not fully formed, the US stock market takes the other side of that trade and states that any negative macro fundamentals are not fully formed either.
Above we have noted some negatives gathering, but we should also realize that several indicators remain a-okay, from the declining 10yr-2yr yield curve (a declining curve tends to go with a strong economy and favor stocks), to a lack of inflation expectations (TIP-TLT tanked on Friday) to the sedate TED spread (admittedly, a laggard) to the long-running zero rate policy (ZIRP) that market participants are currently obsessing about.
Excerpted from the September 21 edition of NFTRH, #309, which went on to do extensive technical and macro work across all the key markets…
Subscribe to NFTRH Premium for your 25-35 page weekly report, interim updates (including Key ETF charts) and NFTRH+ chart/trade ideas!
By Gary Tanashian
© 2014 Copyright Gary Tanashian - All Rights Reserved
Disclaimer: The above is a matter of opinion provided for general information purposes only and is not intended as investment advice. Information and analysis above are derived from sources and utilising methods believed to be reliable, but we cannot accept responsibility for any losses you may incur as a result of this analysis. Individuals should consult with their personal financial advisors.
© 2005-2022 http://www.MarketOracle.co.uk - The Market Oracle is a FREE Daily Financial Markets Analysis & Forecasting online publication.