


ASX200 Stocks Index False Break Low?
Stock-Markets / Austrailia Sep 24, 2014 - 01:41 PM GMTBy: Austin_Galt

 I don't normally put out a report so soon after an in-depth report as was put out just last weekend but some important price action has taken place that I feel warrants a quick follow up. That is the potential for a false break low setup. Let's have a look.
Daily Chart
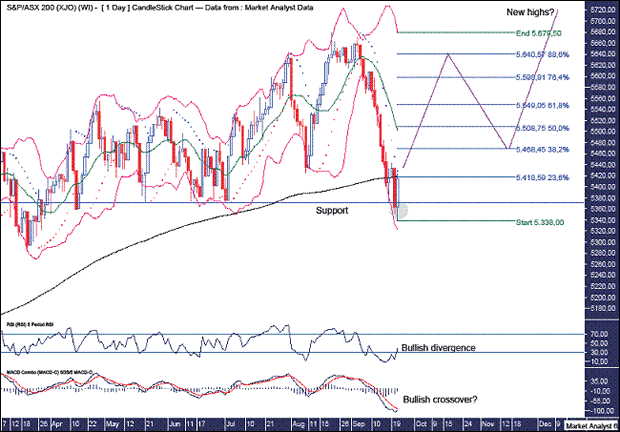
We can see Monday's move down went below the support line that has repelled previous attempts to break down. This support level is obvious so it makes sense for price to trade below there taking out stops in the process.
Then on Tuesday price nudged a touch lower before zooming back up above the support line. This is very bullish behaviour. False breaks are my favourite bottoming (and topping) formation.
The Bollinger Bands show price threatening to break away from the lower band. It will need another big move down to get back to that lower band now. I doubt it.
The black line represents the 200 period moving average which often represents an important support level. We can see it acted like a insect zapper with price being attracted back to it.
The low shows a bullish divergence on the Relative Strength Indicator (RSI) while the Moving Average Convergence Divergence (MACD) indicator looks to be threatening a bullish crossover.
Also, I have added the Parabolic Stop and Reverse (PSAR) indicator which still has a bearish bias with the dots currently just above price at 5429. A more conservative approach for the bulls would be to wait for price to bust those dots.
Given this bearish bias still in the PSAR, I favour a test of the lows before reversing back up and taking out those dots.
I have drawn a green highlighted circle around yesterday's low and the open price. The low was 5338 while the open was 5363. I expect this candle to be consolidated with price trading back to within this range.
I have already taken long positions near yesterday's low and if I see any sign of reversal back up in this range then I will be looking to add to positions. These are the types of trades I look for. That is, trades that are with the trend and offer significant upside with the potential to trade or average up.
I have added the Fibonacci retracement levels of the move down and I now expect price to move up to around the 88.6% level at 5640 before a pullback and then a move to new highs into the end of the year.
I am using the monthly PSAR support of 5321, as shown in my previous report, for my stop loss level.
By Austin Galt
Austin Galt is The Voodoo Analyst. I have studied charts for over 20 years and am currently a private trader. Several years ago I worked as a licensed advisor with a well known Australian stock broker. While there was an abundance of fundamental analysts, there seemed to be a dearth of technical analysts. My aim here is to provide my view of technical analysis that is both intriguing and misunderstood by many. I like to refer to it as the black magic of stock market analysis.
© 2014 Copyright The Voodoo Analyst - All Rights Reserved
Disclaimer: The above is a matter of opinion provided for general information purposes only and is not intended as investment advice. Information and analysis above are derived from sources and utilising methods believed to be reliable, but we cannot accept responsibility for any losses you may incur as a result of this analysis. Individuals should consult with their personal financial advisors.
© 2005-2022 http://www.MarketOracle.co.uk - The Market Oracle is a FREE Daily Financial Markets Analysis & Forecasting online publication.