


U.S. Bond Market Fourth Quarter Trade of 2014
Interest-Rates / US Bonds Oct 03, 2014 - 05:36 PM GMTBy: Chris_Vermeulen

If you have been paying close attention to the stock market, market internals/breadth, and bonds for the past three months, you’ve likely come to the same conclusion that I have.
The US stock market is showing signs of severe weakness with the market breadth and leading indicators pointing to a sharp correction for stock prices.
With fewer stocks trading above their 50 and 200 day moving averages each week, while the broad market S&P 500 index continues to rising, this bearish divergence is a red flag for long term investors.
When a handful of large-cap stocks are the only things propelling the stock market higher while the majority of small-cap stocks are falling you should keep new position sizes smaller than normal and start moving your protective stops up to lock in gains/reduce losses in case the market rolls over sooner than later.
Small cap stocks are typically a leading indicator of the broad market. The Russell 2000 index is what investors should keep a close eye on because it’s the index of small-cap stocks. Since March of this year, the Russell 2000 been trading sideways and actually making new lows. This tells us that big-money speculative traders are rotating out of the stock market and into other investments like high dividend paying stocks, blue chips, and likely bonds.
Looking at the chart below I have overlaid the S&P 500 index and the price of bonds. History has a way of repeating itself; although it may never feel the same and the economy may be different, price action of investments have the tendency to repeat.
In 2011 we saw the stock market and bonds form specific patterns. These patterns clearly show that money was rotating out of the stock market and into bonds. During times of uncertainty in the stocks market money has the tendency to move into bonds, as they are known as a safe haven. Bonds tend to reverse before the stock market does, so if you have never tracked the price chart of bonds before, then you should start.
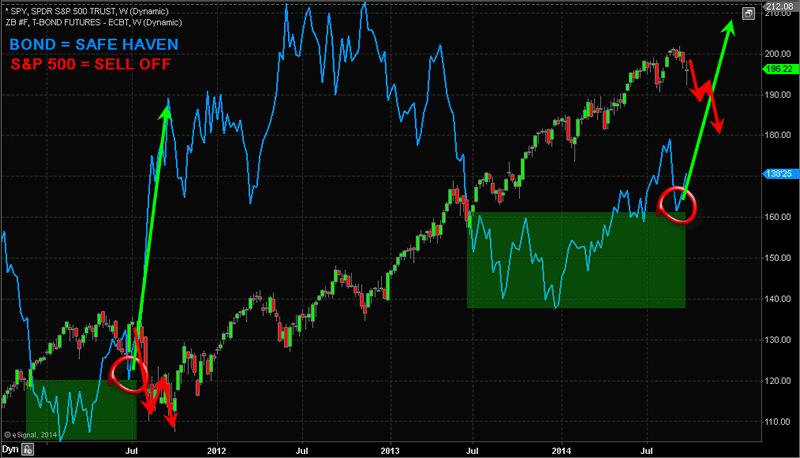
From late 2013 until now bonds and the stock market have repeated the same price patterns from 2011. If history is going to repeat itself, which the technical and statistical analysis is also favoring, we should see the stock market correct 18% to 30% in the near future. If this happens bonds will rally to new highs.
It’s important to realize the chart above is weekly. Each candle represents five trading days, and four candles represents one month. So while this chart points to an imminent selloff from a visual standpoint, keep in mind this could take 2 to 3 months to unfold or longer. The market always has a way of dragging things out. If the market can’t shake you out, it will wait you out.
So if you are short the market or planning to short the market be very cautious as it could be choppy for the next several weeks and possibly months before price truly breaks down and we see price freefall.
Like My Simple Analysis & Tips? Join My Free Newsletter at www.GoldAndOilGuy.com
Want My Trades Automatically Trade for You? www.AlgoTrades.net
Chris Vermeulen
Join my email list FREE and get my next article which I will show you about a major opportunity in bonds and a rate spike – www.GoldAndOilGuy.com
Chris Vermeulen is Founder of the popular trading site TheGoldAndOilGuy.com. There he shares his highly successful, low-risk trading method. For 7 years Chris has been a leader in teaching others to skillfully trade in gold, oil, and silver in both bull and bear markets. Subscribers to his service depend on Chris' uniquely consistent investment opportunities that carry exceptionally low risk and high return.
This article is intended solely for information purposes. The opinions are those of the author only. Please conduct further research and consult your financial advisor before making any investment/trading decision. No responsibility can be accepted for losses that may result as a consequence of trading on the basis of this analysis.
Chris Vermeulen Archive |
© 2005-2022 http://www.MarketOracle.co.uk - The Market Oracle is a FREE Daily Financial Markets Analysis & Forecasting online publication.