


Gold and the S&P 500 Index: Sum and Ratio
Commodities / Gold and Silver 2014 Oct 07, 2014 - 04:09 PM GMTBy: DeviantInvestor

 The US national debt in 1989 was about $2.8 Trillion. Twenty Five years later, in 2014, that debt had increased by a factor of about 6.3 to $17.8 Trillion.
For many decades the US piled on more debt, increased the currency in circulation much more rapidly than the economy grew, and of course, caused consumer prices to increase substantially. Naturally the S&P 500 Index increased, as did the price of gold, since each dollar was worth less.
Consider the graph of the SUM of the S&P 500 Index and the price of gold.
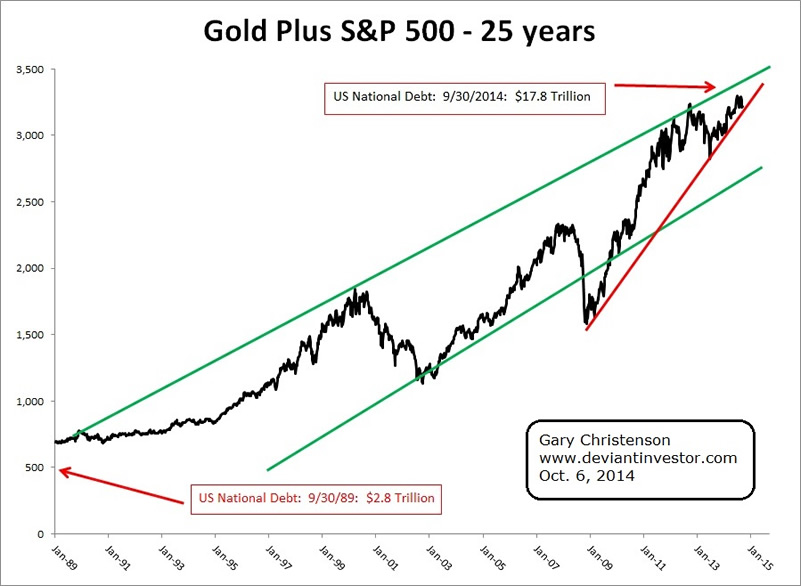
Gold Plus the S&P 500 Index
Debt increased, prices increased, and the dollar purchased less. Now consider the RATIO, as shown in this graph of gold divided by the S&P 500.
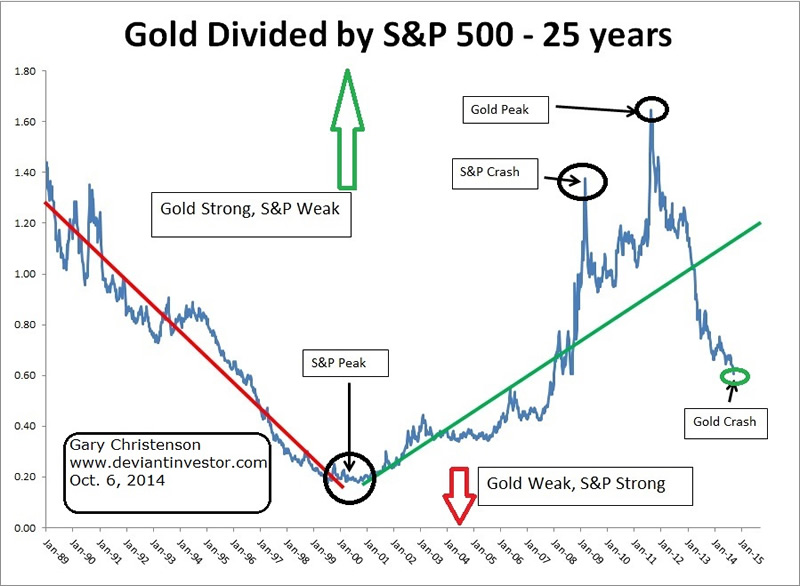
Gold Divided by the S&P 500
The ratio at the gold peak in 1980 was about 8. You can see that the ratio was trending downward from 1980 (graph shows since 1989) to about 2001. Subsequent to the stock market crash of 2000, 9-11, and the massive increase in spending and debt, the ratio now trends upward.
We know that the official national debt is increasing about a $Trillion per year. Graph 1 shows that as debt increases, so does the sum of the S&P and gold. Graph 2 shows that gold increased relative to the S&P from about 2001 to 2011, and then fell. Gold is now deeply oversold compared to the S&P and ready to rally, unless you believe that the US national debt will start decreasing (not likely) or that the S&P will continue skyward for the foreseeable future (not likely).
Will gold reverse tomorrow, next week, next month, or next year? Good luck with that question! My guess is very soon, but the high-frequency-traders, central bankers, and politicians seem to be more influential than physical supply and demand.
Regardless, the critical points are:
- Debt is increasing exponentially and that will not change.
- The sum of gold and the S&P increases along with debt while the purchasing power of the dollar, euro, yen, and pound decreases.
- Gold, relative to the S&P, decreased from 1980 to 2001 and then increased to 2011. It is now quite low compared to the average of the ratio since 1980, and particularly since our modern world changed on 9-11.
- Gold is likely to increase for the next several years relative to the S&P as it “regresses to the mean.” If the S&P falls in the next several years and the sum of gold and the S&P continues to rise, along with debt and consumer prices, then gold will perform nicely as an alternative to unbacked paper currencies supported by nothing but faith and debt.
For more information on gold, read my book: “Gold Value and Gold Prices From 1971 – 2021.” It is available here and here.
GE Christenson aka Deviant Investor If you would like to be updated on new blog posts, please subscribe to my RSS Feed or e-mail
© 2014 Copyright Deviant Investor - All Rights Reserved Disclaimer: The above is a matter of opinion provided for general information purposes only and is not intended as investment advice. Information and analysis above are derived from sources and utilising methods believed to be reliable, but we cannot accept responsibility for any losses you may incur as a result of this analysis. Individuals should consult with their personal financial advisors.
© 2005-2022 http://www.MarketOracle.co.uk - The Market Oracle is a FREE Daily Financial Markets Analysis & Forecasting online publication.