


What Debt Deleveraging?
Interest-Rates / US Debt Oct 23, 2014 - 04:24 PM GMTBy: Harry_Dent

 The best way to delever is to immediately pay off any existing debt, right? So, how can the global economy do that?
There’s a great new study out from Geneva Reports on the World Economy 16 (ICMB — International Center for Monetary and Banking Studies) called Deleveraging? What Deleveraging?
This prestigious group of economists is saying the same thing we’ve been saying and they’re backing it up with the most comprehensive and global analysis we’ve seen yet.
Economists, who want to pretend that things are okay, and that things are getting better, often state that we’ve seen a period of deleveraging and now consumers, corporations and banks are in much better shape.
Here’s the Facts
The truth is that the private sector in the U.S. has deleveraged a little — from $40.9 trillion from 2008 down to $38.2 trillion… that’s 10% less. But since then our total government debt has gone up 53%. From $13.5 to $20.6 trillion.
Foreign debt has risen from $1.5 to $3.1 trillion…
We’ve subtracted $2.8 trillion, but added $8.6 trillion of debt. That’s not deleveraging.
We now have private and government debt of $61.9 trillion vs. $56.1 trillion in 2008. We have more debt, not less… $5.8 trillion more.
As a percent of GDP it has gone down a little as the chart below shows for both the U.S. and the euro zone.
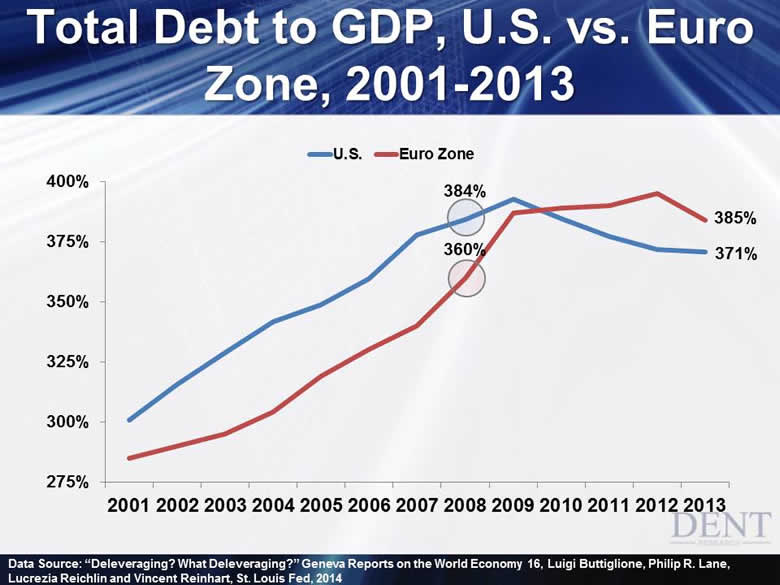
Please note that in the two major developed regions of the world total debt has gone sideways, even as a percentage of GDP. This is also true for the entire developed world as well. This isn’t fair.
An unprecedented government stimulus has artificially inflated the GDP to higher levels.
I’ve circled where the GDP peaked before falling for the U.S. and for the euro zone. When GDP falls rapidly, as it did in mid-2009, it temporarily distorts debt to GDP ratios.
In the U.S., we started around 384% total debt in comparison to the GDP and now we’re at 371%. We’re a tiny bit better off by this measure at 3% lower. If you measure that from 360% in 2008 in the euro zone, total debt is actually about 7% higher than at the beginning of the financial crisis.
The Great Depression
If we go back to 1929 when the last debt and financial bubble peaked, the total debt ratio was about 180% of GDP. Government debt was only about 30% with private debt at 150%.
Here’s the clincher… private debt fell from that 150% of GDP to 50% between 1930 and 1945. Let me point out one thing — that is deleveraging. Private debt at 67% as a percentage of GDP disappeared!
Government debt went up massively, initially due to the depression and to deficits.
The big kick came with World War II. Government debt went from 30% to 115% as a percentage of GDP. If you do the math, that’s up 283%. That’s more than we’re likely to see in the deep financial crisis ahead.
The key here is that private debt can deleverage massively. What if our private debt, peaking at $42 trillion, deleverages by even 50% vs. the 67% in the last winter season?
That would mean that $21 trillion of debt would disappear! Now you see it, now you don’t.
Debt is like magic with money created out of thin air by the fractional reserve system.
When money disappears from writing down or canceling debts, you get deflation: less money chasing the same goods.
The U.S. government has printed about $4 trillion dollars in the last six years. Which is bigger: adding $4 trillion or $21 trillion disappearing? That’s how you get deflation despite money printing.
The Real Deal
I’m going to cover this topic in much more depth in the November issue of The Leading Edge. I will include some new charts from this Geneva report along with some updated charts from our research.
It’s not just debt that’ll disappear in a deep crisis ahead; it’ll be even more in financial assets: stocks, real estate and commodities, etc. Financial assets do bubble even more than debt and it creates more money in the chase.
When the bubble bursts, those assets deflate rapidly and destroy the money and wealth that consumers, and businesses, were planning on using in their future.
In this last time central banks reflated most financial assets but the next time they won’t have the public’s confidence to do so again. People will lose faith in the concept that a financial crisis and debt bubble can be remedied by simply filling in the crater with free money…
We all know you don’t get something for nothing.
When I add up all of the debt and financial assets that could deflate I come to the conclusion that there simply is no way the government can print enough money to fill in the next, and even bigger, crater that is coming.
Prepare your portfolio for deflation, not inflation.
Now is not the time to listen to the gold bugs, even though many are as astute as we are in looking at the debt, leverage and financial reality. They just haven’t thought through what happens when the bubble deleverages.
History clearly shows that deflation follows, not inflation.
Harry
Follow me on Twitter @HarryDentjr
Harry studied economics in college in the ’70s, but found it vague and inconclusive. He became so disillusioned by the state of the profession that he turned his back on it. Instead, he threw himself into the burgeoning New Science of Finance, which married economic research and market research and encompassed identifying and studying demographic trends, business cycles, consumers’ purchasing power and many, many other trends that empowered him to forecast economic and market changes.
Copyright © 2014 Harry Dent- All Rights Reserved Disclaimer: The above is a matter of opinion provided for general information purposes only and is not intended as investment advice. Information and analysis above are derived from sources and utilising methods believed to be reliable, but we cannot accept responsibility for any losses you may incur as a result of this analysis. Individuals should consult with their personal financial advisors.
© 2005-2022 http://www.MarketOracle.co.uk - The Market Oracle is a FREE Daily Financial Markets Analysis & Forecasting online publication.