U.S. Economy Faltering Momentum, Debt and Asset Bubbles
Economics / US Economy Oct 23, 2014 - 04:40 PM GMTBy: John_Mauldin
 I featured the thinking of Dr. Lacy Hunt on the velocity of money and its relationship to developed-world overindebtedness and the potential for deflation in this week’s Thoughts from the Frontline, and I thought you’d like to peruse Lacy’s entire recent piece on the subject.
Lacy takes the US, Europe, and Japan one by one, examining the velocity of money (V) in each economy and bolstering the principle, first proposed by Irving Fisher in 1933, that V is critically influenced by the productivity of debt. Then, turning to the equation of exchange (M*V=Nominal GDP, where M is money supply), he demonstrates that we shouldn’t be the least bit surprised by sluggish global growth and had better be on the lookout for global deflation.
Hoisington Investment Management Company (www.Hoisingtonmgt.com) is a registered investment advisor specializing in fixed-income portfolios for large institutional clients. Located in Austin, Texas, the firm has over $5 billion under management and is the sub-adviser of the Wasatch-Hoisington US Treasury Fund (WHOSX).
I am writing this note in a car going to Athens, Texas, where I’ll join Kyle Bass and friends at his Barefoot Ranch for a huge macro fest. October is one of my favorite times of the year to be in Texas, and the ranch is a beautiful venue. I am sure I will have some challenging conversations.
Last night in Chicago I was picked up by Austyn Crites, who drove me downtown in rush-hour traffic, which gave us a lot of time to talk about his current passion, high balloons. I have been fascinated with them for some time, but there hasn’t been a lot of reliable information.
Basically, Google and Facebook are both planning to launch very large helium balloons full of radios and cameras and float them up to 60,000+ feet. The concept is working in several remote locations now. It’s a way to get full wireless internet coverage. With about 40,000 balloons you can blanket the earth. Literally. Full connectivity. Everywhere. Austyn wants to design a new type of balloon and be the manufacturer. It’s tricky as you need a VERY thin balloon envelope (that does not leak) the size of small house in order to get enough payload that high.
But he thinks the final cost of the balloons will fall dramatically and that you might be able eventually to pull off the operation for a billion or so a year (since balloons eventually come down and need to be replaced).
But if you are Google and you get the search revenue from connecting an additional five billion people? Chump change. Same for Facebook. But what if Apple or Samsung want to make it so that their phones are afforded free or very cheap access? A consortium of consumer companies could easily see free wifi as a tool for branding. Current telecoms will have to get in the business to compete.
I kept coming back to the costs and tech issues. There are new things that will have to be invented, but nothing as complex as some of the problems that have already been overcome. They will be rolling out in parts of the world in a few years. Coming to a region near you in 5-10 years. Total game changers. While a hundred other game changers are coming down the tunnel.
Austyn's company’s challenge is to be the little guys who don't know they can't invent a new process that the big guys are working on as well. Can he pull it off? He has the passion and drive. I love meeting young people like him doing their part to change the world. They are everywhere, too. It's why I’m optimistic about the future of the human experiment, if just a tad bearish on governments. You can follow Austyn at his website.
Time to hit the send button, as we are getting close and I don't want to miss a minute. I will report back what I can. Have a great week.
Your dreaming of really, really cheap, ubiquitous connectivity everywhere analyst,
John Mauldin, Editor
Outside the Boxsubscribers@mauldineconomics.com
Hoisington Investment Management – Quarterly Review and Outlook, Third Quarter 2014
Faltering Momentum
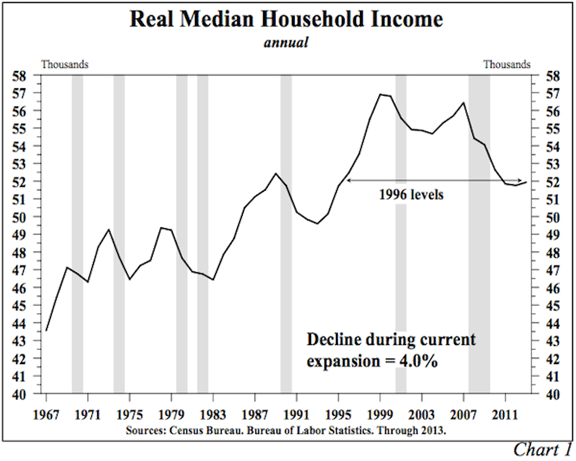
The U.S. economy continues to lose momentum despite the Federal Reserve’s use of conventional techniques and numerous experimental measures to spur growth. In the first half of the year, real GDP grew at only a 1.2% annual rate while real per capita GDP increased by a minimal 0.3% annual rate. Such increases are insufficient to raise the standard of living, which, as measured by real median household income, stands at the same level as it did seventeen years ago (Chart 1).
Over the latest five years ending June 30, 2014, real GDP expanded at a paltry 2.2% annual rate. In comparison, from 1791 through 1999, the growth in real GDP was 3.9% per annum. Similarly, real per capita GDP recorded a dismal 1.4% annual growth rate over the past five years, 26% less than the long-term growth rate. A large contributor to this remarkable downshift in economic growth was that in 1999 the combined public and private debt reached a critical range of 250%-275% of GDP. Econometric studies have shown that a country’s growth rate will lose about 25% of its “normal experience growth rate” when this occurs. Further, as debt relative to GDP moves above critical threshold levels, some researchers have found the negative consequences of debt on economic activity actually worsens at a greater rate, thus becoming non-linear. The post-1999 record is consistent with these findings as the U.S. debt-to-GDP levels swelled to a peak as high as 360%, well above the critical level noted in various economic studies.
In terms of growth, it looks as if the second half of 2014 will continue to follow this slow growth pattern. Although all of the data has not yet been reported, it appears that the year-over-year growth in real GDP for the just ended third quarter period is unlikely to exceed the 2.2% pace of the past five years. Economic vigor is absent, and the final quarter of the year looks to be weaker than the third quarter.
Poor domestic business conditions in the U.S. are echoed in Europe and Japan. The issue for Europe is whether the economy triple dips into recession or manages to merely stagnate. For Japan, the question is the degree of the erosion in economic activity. This is for an economy where nominal GDP has been unchanged for almost 22 years. U.S. growth is outpacing that of Europe and Japan primarily because those economies carry much higher debt-to-GDP ratios. Based on the latest available data, aggregate debt in the U.S. stands at 334%, compared with 460% in the 17 economies in the euro-currency zone and 655% in Japan. Economic research has suggested that the more advanced the debt level, the worse the economic performance, and this theory is in fact validated by the real world data.
Falling World Wide Inflation
In this debt-constrained environment, it is not surprising that inflation is receding sharply in almost every major economy, including China. The drop in price pressures in the U.S. and Europe is significant, and the fall in Chinese inflation to 2%, from a peak of nearly 9% in 2008, is notable.
In the latest twelve months, the CPI in the euro currency zone rose a scant 0.3% (Chart 2), the lowest since 2009, while the core CPI increased by 0.7%, near the all time lows for the series. The yearly gain in the U.S. for both core and overall CPI was 1.7%. Since 1958 when the core CPI came into existence, it and the overall CPI have increased at an average annual rate of 3.8% and 3.9%, respectively, over 200 basis points greater than the current rates. Both the overall and core personal consumption expenditures U.S. price indices rose by 1.5% in the twelve months ending August of 2014. Both of these are near the all time lows for their respective series.
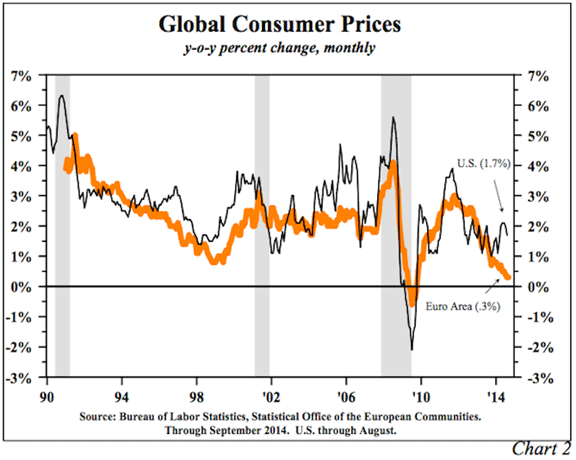
The risk of outright deflation in Europe with inflation at such low levels, and the danger of similar developments in the U.S., should not be minimized as inflation has fallen in almost every previous U.S. and European economic contraction. Lower inflation is, in fact, almost as much of a hallmark of recessions as is decreasing real GDP. From peak-to-trough the rate of CPI inflation fell by an average of slightly more than 300 basis points in and around the mild U.S. recessions of 1990-91 and 2000-01. Starting from a much lower point, the CPI in Europe at those same times dropped by an average of 150 basis points. Given that inflation is already so minimal in both the U.S. and Europe, even the mildest recession could put both economies in deflation.
Japan’s recent quantitative easing has helped devalue its currency by 44% versus the dollar, since the 2011 lows. This import- dependent country has therefore seen its costs rise dramatically. This, along with higher consumption taxes, has created a current year- over-year inflation rate of 3.3%. These higher prices are an enormous drag on economic growth as incomes fail to rise commensurately. Thus negative GDP growth will result in a continuing pattern of deflation. Japan’s CPI has been zero or negative on a year-over-year basis in 16 of the last 23 quarters.
Declining Money Velocity A Global Event
One factor that connects poor growth with the low inflation and low bond yields evident in the U.S., Europe and Japan is that the velocity of money (V) is falling in all three areas.
Functionally, many things influence V. The factors that could theoretically influence V in at least some minimal fashion are too numerous to count. A key variable, however, appears to be the productivity of debt. Money and debt are created simultaneously. If the debt produces a sustaining income stream to repay principal and interest, then V will rise since GDP will rise by more than the initial borrowing. If the debt is unproductive or counterproductive, meaning that a sustaining income stream is absent, or worse the debt subtracts from future income, then V will fall. Debt utilized for the purpose of consumption or paying of interest, or debt that is defaulted on will be either unproductive or counterproductive, leading to a decline in V.
The Nobel laureate Milton Friedman, as well as economist Irving Fisher, commented on the causal determinants of V. Friedman thought V was stable while Fisher believed it was variable. Presently, the evidence suggests that Fisher’s view has prevailed. Fisher would not be at all surprised by the current impact of excessive debt since he argued in his famous 1933 paper “The Debt-Deflation Theory of Great Depressions”, that falling money velocity is a symptom of extreme over-indebtedness.
Tracking that theory, it is interesting to note that velocity is below historical norms in all three major economic areas with existing over indebtedness. The U.S. V is higher than European V, which in turn is higher than Japanese V. This pattern is entirely consistent since Japan is more highly indebted than Europe, which is more highly indebted than the U.S. Unfortunately, broad monetary conditions (M2 money growth and velocity) are deteriorating, with 2014 displaying conditions worse than at the end of last year. The poor trend in the velocity for all three areas indicates that monetary policy for these countries is not a factor in influencing economic activity in any meaningful way.
United States. The U.S. year-over-year M2 growth has remained at about 6%, an annual growth level that has been consistent since 2008 (Chart 3), and the velocity of money has trended downward by about 3%. In the first half of 2014, V declined at a rate of 3.6%, but it is still too early to tell if this represents a new V deceleration to the downside (Chart 4).
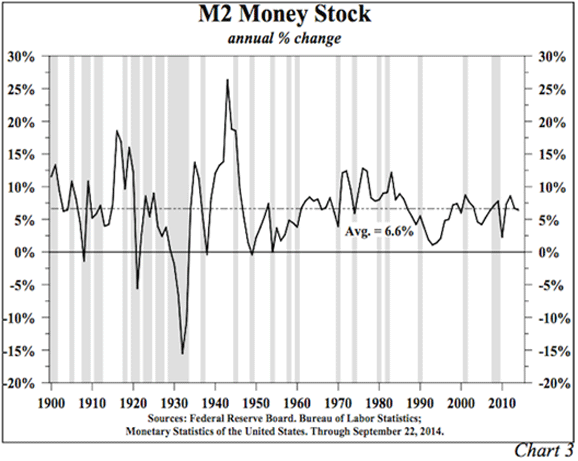
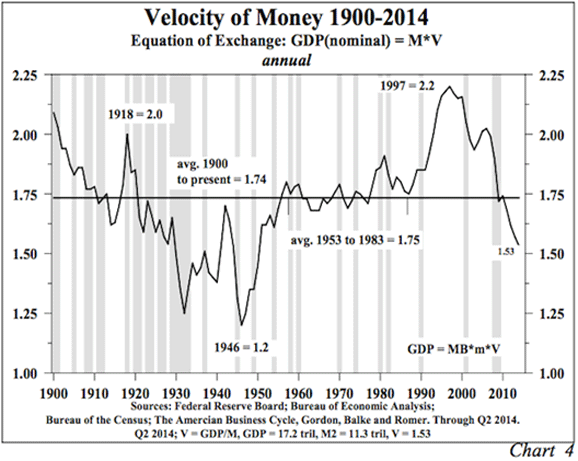
According to the equation of exchange (M*V=Nominal GDP), the expected growth of nominal GDP is constrained to no more than a 3% increase with velocity declining by 3% and money supply expanding by 6%. However, when assessing the type of debt currently being employed (unproductive, at best) the risks are for lower growth levels. 2014 has witnessed a resurgence of consumer auto and mortgage lending that was achieved by a lowering of credit standards. The percentage of subprime consumer auto loans (31%) returned to the peak levels reached prior to 2008. Such lending has historically turned counterproductive. If this were to occur again, velocity would accelerate to the downside, resulting in a sub 3% path for nominal GDP.
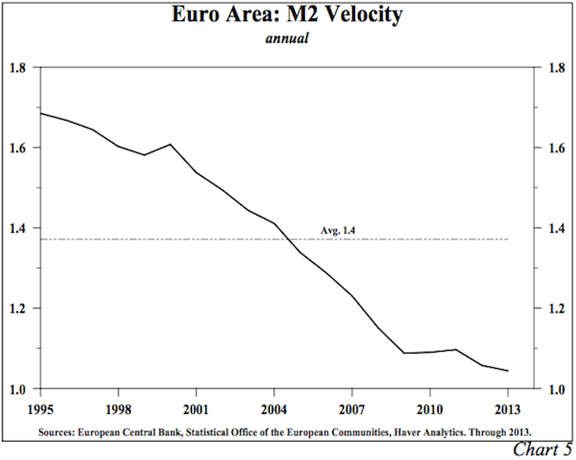
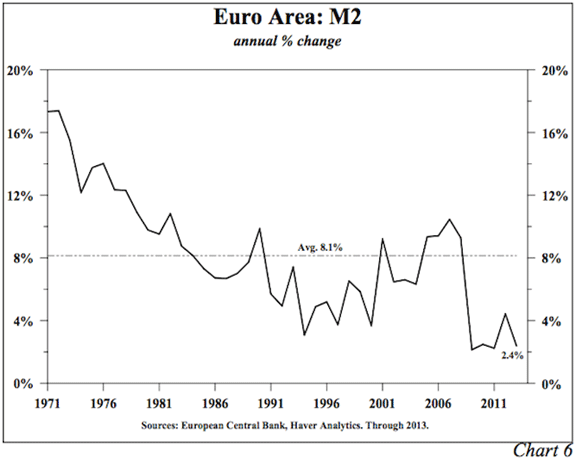
Europe. V has only been available in Europe since 1995 as that is the starting date for GDP in the euro-currency zone. During the span from 1995 through 2013, V averaged 1.4, dropping from a peak of about 1.7 in 1995 to 1.03 in 2013 (Chart 5). Over that span, therefore, euro V has been trending lower at about a 2.6% per annum rate. On the money side, euro M2 increased by 2.4% in 2013, which is weaker than the average growth in the last four years (Chart 6). If the trend rate of decline in V remains intact, then nominal GDP in the euro zone could be flat. Inflation of any magnitude would result in a negative real GDP outcome.
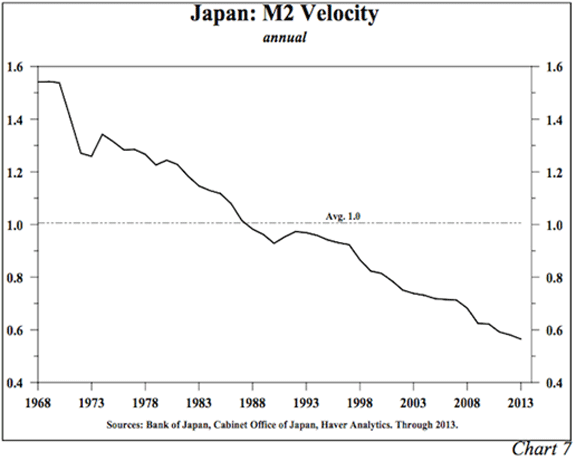
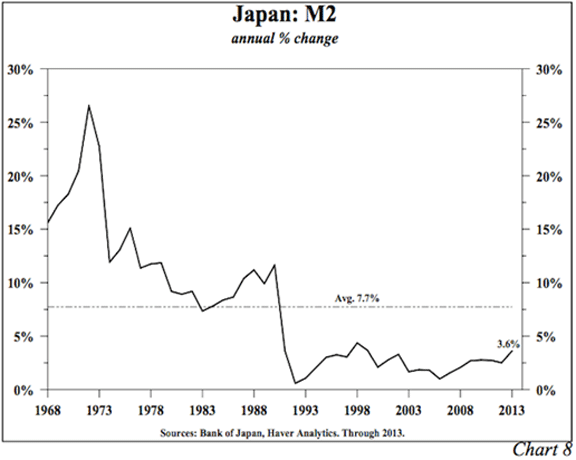
Japan. From the start of the comparable M2 and nominal GDP statistics in 1969 in Japan, V in Japan has averaged 1.0, dropping from 1.54 in 1968 to a record low of 0.57 in the latest year (Chart 7). Thus, over this period V was falling at an average rate of 2.2% per annum. M2 in Japan increased 3.6% in 2013, which is slightly higher than the growth rate of recent years (Chart 8). If V’s downward trend remains intact, nominal GDP would be estimated to grow by 1.2%. However, inflation is currently running at 3.3%, suggesting real GDP could decline by over 2% in the next twelve months. This circumstance illustrates the double-edged sword caused by a sharply depreciating currency. The weaker yen boosts exports but raises domestic inflation. Japanese inflation is already exceeding the rise in wages and household spending. These events are consistent with a contraction in economic activity and are the expectation derived from the analysis of money growth and its velocity.
Debt Research
Important new research by four distinguished economists (three in Europe and one in the U.S.) is contained in a report titled "Deleveraging? What Deleveraging?" (Luigi Buttiglione, Philip R. Lane, Lucrezia Reichlin and Vincent Reinhart, Geneva Reports on the World Economy 16, September 2014). It provides additional evidence on the role of “debt dynamics” and the state of the global debt overhang. They write, “Contrary to widely held beliefs, the world has not yet begun to delever and the global debt-to-GDP is still growing, breaking new highs.” Further, it is a "poisonous combination" when world growth and inflation are lower than expected and debt is rising. “Deleveraging and slower nominal growth are in many cases interacting in a vicious loop, with the latter making the deleveraging process harder and the former exacerbating the economic slowdown.”
This research also identifies two other highly significant trends. First, global debt accumulation was led by developed economies until 2008. Second, the debt build-up since 2008 has been paced by the emerging economies. The authors write that the rise in Chinese debt is especially “stunning”. They describe China as “between a rock (rising and high debt) and a hard place (lower growth).” In addition to China they identify India, Turkey, Brazil, Chile, Argentina, Indonesia, Russia and South Africa as belonging to the “fragile eight” group of countries that could find themselves in the unwanted role of host to “the next leg of the global leverage crisis.”
We interpret this research to mean that the monetary policy may begin to become ineffective at emerging market central banks, just as has happened in the U.S., Europe and Japan. Weaker growth conditions in the emerging markets are thus likely to accentuate, rather than ameliorate, poor business conditions in the major economies. Indeed, this year’s downturn in global commodity prices is consistent with the beginning of such a phase. The huge jump in emerging market debt is also significant because research has found the severity of economic contractions is directly related to the leverage in the prior expansion.
Asset Bubbles
Historically, in our judgment, the most important authority on the subject of asset bubbles was the late MIT professor Charles Kindleberger, author of 20 books including the one of the greatest books on capital markets Manias, Panics and Crashes (1978). He found that asset price bubbles depend on the growth of credit. Atif Mian (Princeton) and Amir Sufi (University of Chicago) provided confirmation for Kindleberger’s pioneering work and expanded on it in their 2014 book House of Debt. Chapter 8, entitled “Debt and Bubbles,” contains the heart of their insights. Mian and Sufi demonstrate that increasing the flow of credit is extremely counterproductive when the fundamental problem is too much debt, and excessive debt can fuel asset bubbles.
Based on our reading of these two books we would define an asset bubble as a rise in prices that is caused by excess central bank liquidity rather than economic fundamentals. As Kindleberger clearly stated, the process of excess liquidity fueling higher prices in the face of faltering fundamentals can run for a long time, a phase Kindleberger called “overtrading”. But eventually, this gives way to “discredit”, when the discerning few see the discrepancy between prices and fundamentals. Eventually, discredit yields to “revulsion”, when the crowd understands the imbalance, and markets correct.
Economists have commented on the high correlation between the S&P 500 and the Fed’s balance sheet since 2009. From 2009 to the latest available month, the monetary base (MB) surged from $1.7 trillion to $4.1 trillion. We ran the MB increase against the S&P 500 and found a very high correlation of 0.69. While correlation does not prove causality, the high correlation is certainly not inconsistent with the idea that the Fed liquidity played a major role in boosting stock prices. However, even as the MB has exploded since 2009 and stock prices have soared, the U.S. economy has experienced the worst economic expansion on record. In spite of a further large rise in the base this year, the GDP growth has subsided noticeably and corporate profits after taxes and adjusted for inventory gains/losses (IVA) and over/under depreciation (CCA) has declined 10% in the latest four quarters. Such discrepancy between the liquidity implied by the base and measures of economic performance could indicate the process of bubble formation. Kindleberger’s axiom that asset price bubbles depend on excess liquidity may yet face another test.
Still Bullish on Treasury Bonds
With the nominal growth trajectory extremely soft, U.S. Treasury bond yields are likely to continue working lower as similar circumstances have created declines in government bond yields in Europe and Japan. Viewing the yields overseas, it is evident that ample downside still exists for long U.S. Treasury bond yields, as the higher U.S. yields offer global investors an incentive to continue to move funds into the United States.
Another factor suggesting lower long- term U.S. Treasury yields is the strength of the U.S. dollar. In many industries, the price leader for certain goods in the U.S. is a foreign producer. A rising dollar leads to what economists sometimes call the “collapsing umbrella”. As the dollar lifts, the foreign producer cuts U.S. selling prices, forcing domestic producers to match the lower prices. This reinforces the prospect for lower inflation as nominal GDP wanes. This creates a favorable environment for falling U.S. Treasury bond yields.
Van R. Hoisington
Lacy H. Hunt, Ph.D.
Like Outside the Box?
Sign up today and get each new issue delivered free to your inbox.
It's your opportunity to get the news John Mauldin thinks matters most to your finances.
John Mauldin Archive |
© 2005-2022 http://www.MarketOracle.co.uk - The Market Oracle is a FREE Daily Financial Markets Analysis & Forecasting online publication.


