US Stock Market Top Is Now In Sight
Stock-Markets / Stock Markets 2014 Oct 24, 2014 - 01:11 PM GMTBy: Submissions
 Dr. David J Harris writes: SUMMARY:
- In June, the DJIA index signaled that a significant US market top is near and will be reached in the next few weeks or months.
- In July, a new market timing model calculated that the market top is likely to occur in either, the last two weeks of July, a seven week window covering the last four weeks of October and first three weeks of November, or the four week window covering the last two weeks of December and first two weeks of January.
- Analysis of previous market tops and market bottoms shows that these windows of opportunity are close to 100% accurate.
- The market timing model determines that the resulting market drop is likely to be at least 12% and could be as much as 33%.
- Price projection analysis indicates that a rally is possible in late December and that the likelihood of a market top at year end is slightly greater than the likelihood of a market top in October or November.
MARKET TOP SIGNAL
In mid-June, the DJIA index signaled that a US market top is near, using a proprietary market timing model developed over the last few years. This DJIA market top signal only happens, on average, every 6 years, and has been recorded 21 times since the start of the DJIA index in 1885, almost 130 years ago. The signal occurs at major US market tops, and was triggered in 1999 before the 2000 market top and again in 2007 before the previous market top in October 2007.
The signal is 100% accurate, since all 21 instances of the signal have led to significant market drops. The signal also occurred prior to the 1929 stock market crash during the great depression and prior to the 1987 stock market crash. There are no false positives.
Analysis of the 21 previous occurrences of the signal provides the following statistics. The minimum DJIA drop after the signal was recorded is 12%. The average market drop is 33%. The worst market drop was 90% during the US Great Depression. So we are in for a rough ride when the market top finally occurs. We can expect a drop in the DJIA of between 12% and 33%.
The market timing model cannot pin-point the exact moment that the market top will occur. For this reason, a second, statistically based, market timing tool has been built that provides a more accurate likelihood of when the market top will occur.
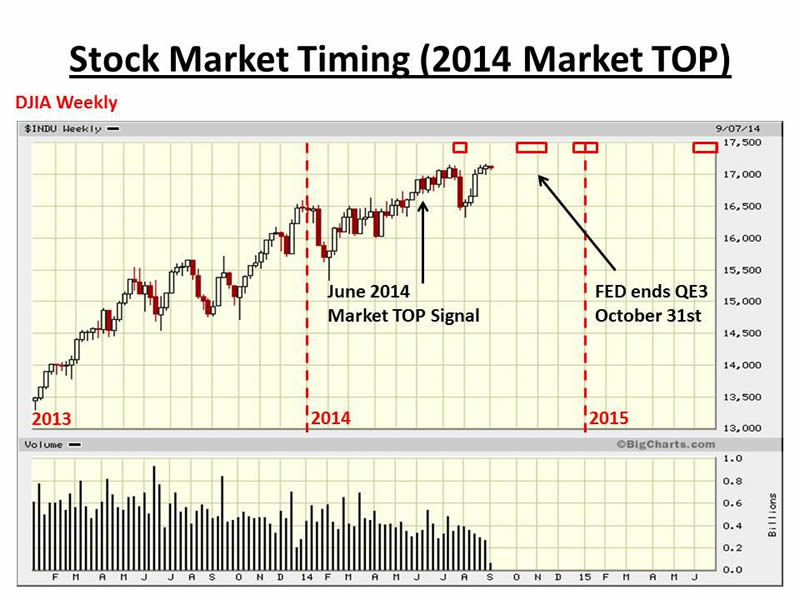
The new market timing tool, developed in June of this year, has been used to determine a number of possible windows to pin-point the timing for a significant stock market top. We now know that the window in July was too early. Hence, the next three windows of opportunity calculated by the market timing tool are:-
[1] A seven week window from Monday Oct 6 to Friday Nov 21
[2] A four week window from Monday Dec 22 to Friday Jan 16
[3] A multi-month window covering spring and summer of 2015
Below is a chart showing the windows of opportunity (red boxes) as they were first calculated during the early summer of 2014, once the market top signal was recorded in Mid-June.
MARKET TOP SIGNAL FOR 2000
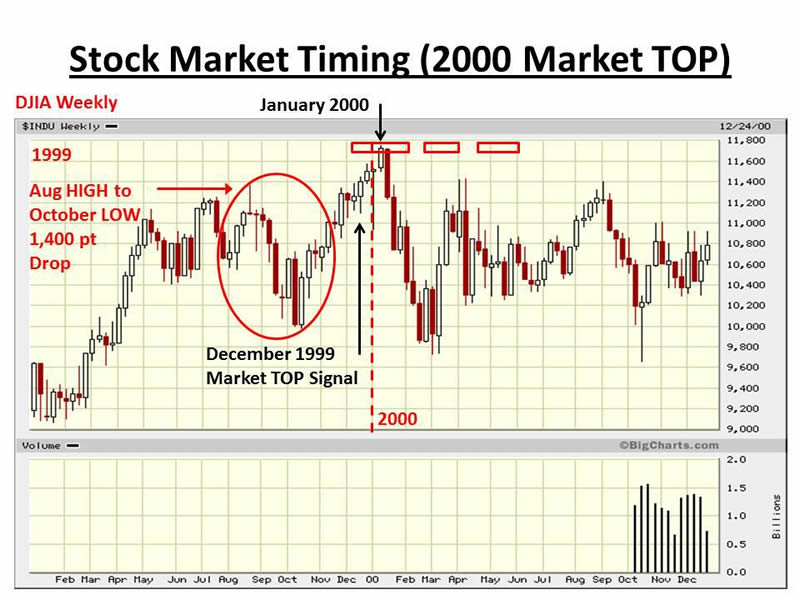
This section covers the DJIA stock market top in January of 2000. The chart below shows the initial market top signal recorded in December 1999, and the three windows of opportunity calculated to cover December and the first five months of 2000. The new market timing tool has been used retrospectively in this case.
Notice that there was a very sharp drop in the DJIA of 1,400 points just weeks before the final sprint up to the January 2000 stock market top. This is significant since we are now, in October 2014, experiencing the same type of sharp drop that I believe will eventually result in a similar rally into December 2014, and a DJIA market top at year-end.
MARKET TOP SIGNAL FOR 2007
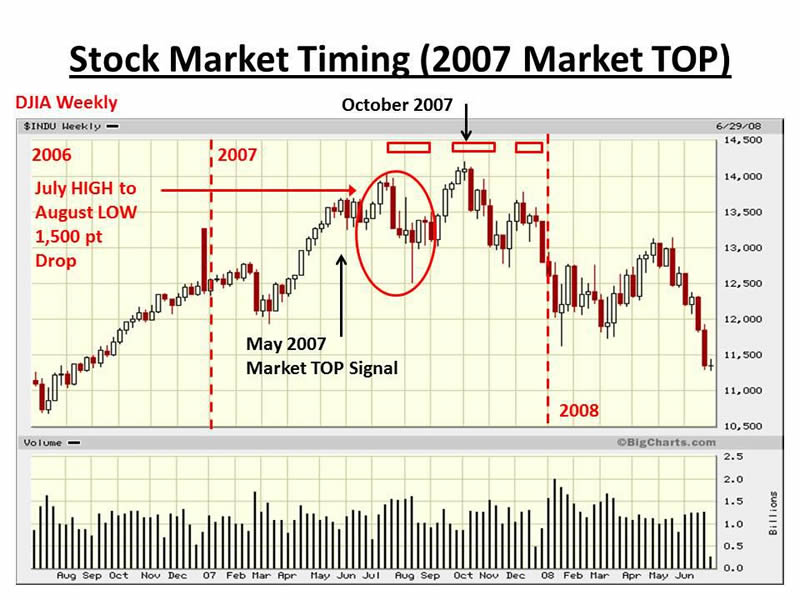
Similar to the previous section, this section covers the DJIA stock market top in October of 2007. The chart below shows the initial market top signal recorded in May 2007, and the three windows of opportunity calculated to cover the six month period from July 2007 to December 2007. The windows have been calculated retrospectively.
Again, notice that there was a very sharp market drop of 1,500 points just weeks before the final sprint up to the October 2007 stock market top. Once more, this is significant since we are now, in October 2014, going through the same type of sharp drop as presented in the previous section
CURRENT MARKET TOP SIGNAL FOR 2014
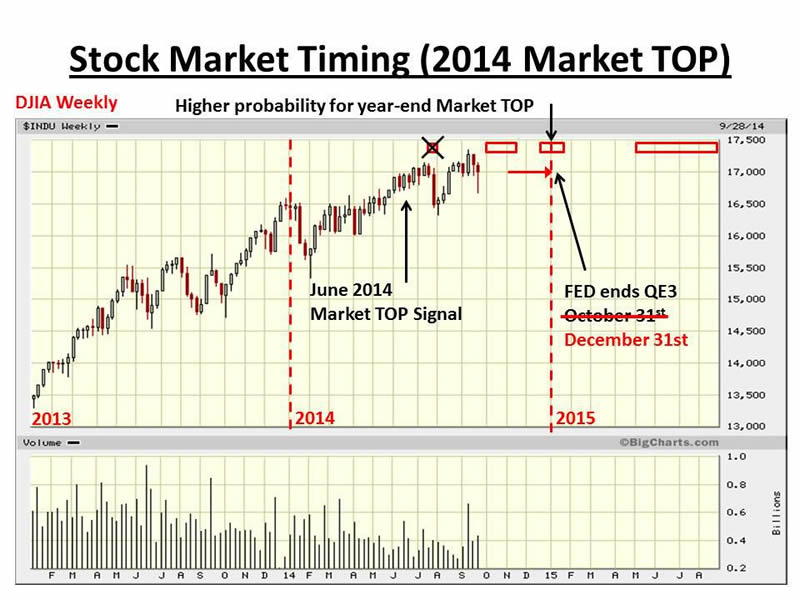
Moving forward to the current timeframe, a brand new tool has been developed over the last few days of September to determine which of the windows in late 2014 has a higher likelihood of pin-pointing the stock market top. Statistically, the new tool calculates that there seems to be a slightly higher probability for the end of year window to be the most likely window. This would suggest a year-end rally similar to last year. Also, it would agree with the growing consensus of a few key market commentators that we are likely to see a rally at year-end, and that there is a reasonable likelihood that the DJIA could reach 18,000 during the same time period.
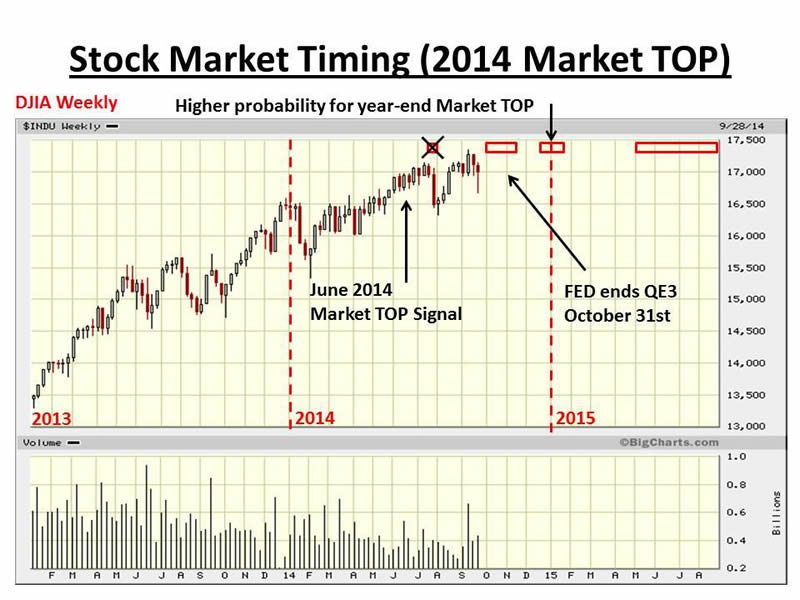
Analysis of previous significant market tops and bottoms indicates that 95% of previous market tops and bottoms have occurred during the windows of opportunity, and that the remaining 5% have occurred between two closely aligned windows, rendering this technique very accurate.
POTENTIAL CHANGE TO QE3 AT OCTOBER FOMC MEETING
The fact that QE3 is on schedule to finish at the end of October counts against the possibility of a year-end rally. However, if the FED were to change the pace of tapering at the October meeting and continue a small amount of purchasing through November and into December then we could see a top at year-end. Certainly, I don't believe the FED wants to risk the market falling just before year-end, and therefore there might just be such a surprise at the October meeting of the FOMC that keeps the market climbing into year-end.
Comments in the press the week of October 13-17 suggest that the FED may actually be seriously considering this option. The chart below shows this change.
CURRENT MARKET DROP IN MID-OCTOBER
As presented in earlier sections, there was a sharp market drop just weeks before the final stock market rally to a new significant top, in both 2000 and 2007. If we assume that the same type of drop is now underway in October 2014, then it is possible to calculate (using simple ratios) that the DJIA index may drop down to the 15,500 to 16,000 range before reaching a short-term bottom. During the week of October 13-17 the market did drop down to the upper part of this range, and it is possible that in the coming weeks that the DJIA index might make one further dip down into the lower part of the range prior to the FOMC meeting due the last week of October.
Finally, there is a significant level of support on the DJIA weekly chart at the 16,000 level which adds further strength to the assumption that the DJIA index will bounce at around the 16,000 level. To be specific, the DJIA can close below the 16,000 level mid-week, but must climb back up above a value of 16,016 by close of business Friday each week to ensure that the upward momentum on the weekly chart remains intact.
SHORT-TERM MARKET TOP SIGNALS
We have experienced a series of new all-time stock market highs in the DJIA index in July and in September. There have been some statements in the press that the recent high in September might be the actual top. I disagree. While it is believed that a significant stock market top is imminent, there are certain other signals that would be expected at a market top, and these were not present.
In total, I monitor 16 short-term market top signals that occur within days or weeks of a market top, and so far only one signal has been triggered recently. The chart below shows the current state of the 16 signals, with regard to the recent top in September. The red arrows show the single signal that has triggered, and an additional signal that is close to a positive signal.
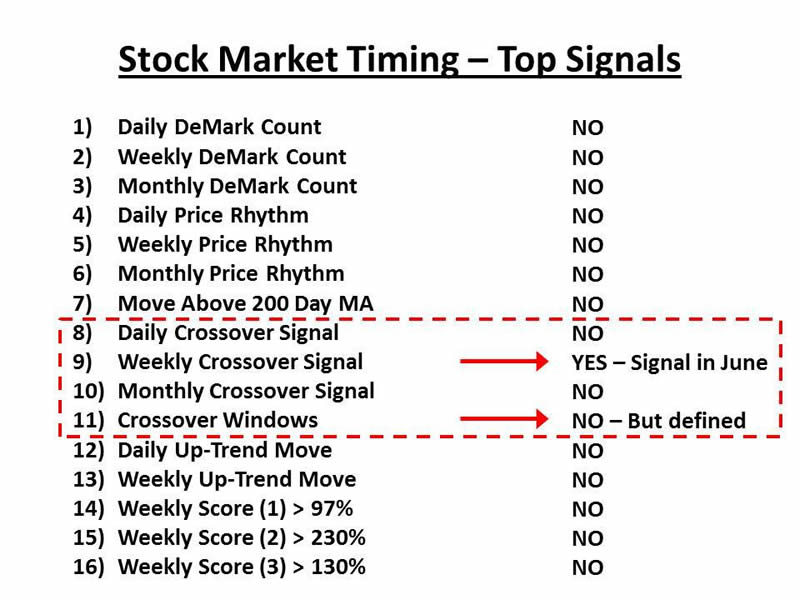
It is not expected that all 16 signals will trigger prior to the market top, but a majority would need to trigger to indicate that the top has occurred. For example, the four signals in the dashed red box above can only generate two signals since signals (8), (9) and (10) are mutually exclusive, and it is highly likely that only one of these three would trigger at a specific market top event. For this reason, only a total of 14 signals could ever trigger positive at a market top, however, a number somewhere in the range between nine and fourteen would be sufficient to signal a top.
REASONS FOR MARKETS TO DROP
There are currently a multitude of active geo-political and financial risks that could lead to a significant drop in the markets. These include the end of QE3, weak US earnings for Q3, weak growth in Europe, weak growth in China, default in south America, issues in the Middle East, issues in Ukraine and the outbreak of Ebola in West Africa growing out of control in coming months. Any one of these issues, or a combination of issues could be the catalyst (or seen by the press as a catalyst), however, the basic technical state of the US stock market is ripe for a correction so I believe the game of guessing what the cause might be is mostly futile, its going to happen because the market is over stretched.
BUBBLE TROUBLE IN ARGENTINA & VENEZUELA
The stock market in Argentina (MERV index) continued to climb higher through late summer, and the growth in the bubble that has formed has been so prolific that the status of the bubble changed in late September from a 'Super' bubble to a 'Mega' bubble, now the largest type of bubble that stock markets reach before bursting. Over the summer Argentina's index completed an upward momentum sequence of phase 1, phase 2 and phase 3 with phase 3 count #13 being reached the last week of September. This then resulted in a sudden drop during the first few trading days of October as some stock holders looked to book profits. The downward momentum stalled to the extent that there should be one more attempt to reach a new all-time high, which most likely will be successful.
Also note that the IBC index in Venezuela is also in a 'Mega' bubble state, and it also reached a new market high in September this year, climbing above the previous market high recorded in Q1 of this year.
US TREASURY 10 YEAR YIELD
The yield on the 10 year US Treasury note continues to head lower with consistent downward momentum. Evidence of the move lower is present on the yearly chart and the weekly chart of $TNX. The monthly chart was also showing a consistent trend of downward momentum, however, at the end of September the downward momentum sequence was broken. If downward momentum remains strong on the yearly and weekly charts, then we will potentially see the downward momentum being re-established on the monthly chart. It is anticipated that we will see an all-time low in yields sometime in mid to late 2015, or at least a double bottom matching the 2012 low in the 10 year yield.
Hence, a continued move lower in treasury yield through 2014 into 2015 and perhaps into early 2016, would be consistent with a "fear trade" brought on by the threat of a US recession and / or the ending of QE3 this year.
Disclosure: The author has no positions in any stocks mentioned, and no plans to initiate any positions within the next 72 hours.
David Harris is an independent stock market investor and trader with an interest in modeling price movements in stock markets. In particular, David has spent the last ten years developing mathematical models to identify market tops and market bottoms and more recently a model that identifies bubbles in national stock market indices and individual stocks. Trained originally as an Electronic Engineer, David has a First Class Honors Degree in Electronic and Electrical Engineering from Leeds University, UK and a PhD in Adaptive Control Algorithms, also from Leeds University. David has worked as a Senior IT Manager in the City of London and more recently in New York City for a variety of Investment Banks, including NatWest ...More Markets, Bankers Trust, Deutsche Bank, Bank of Bermuda and HSBC Bank.
© 2014 Copyright Dr. David J Harris - All Rights Reserved Disclaimer: The above is a matter of opinion provided for general information purposes only and is not intended as investment advice. Information and analysis above are derived from sources and utilising methods believed to be reliable, but we cannot accept responsibility for any losses you may incur as a result of this analysis. Individuals should consult with their personal financial advisors.
© 2005-2022 http://www.MarketOracle.co.uk - The Market Oracle is a FREE Daily Financial Markets Analysis & Forecasting online publication.


