


What Crude Oil's Ratios Are Saying About Future Price Moves?
Commodities / Crude Oil Nov 08, 2014 - 12:03 PM GMTBy: Nadia_Simmons

 Without a doubt, Oct was the worst month for oil bulls since May 2012. In the previous month, the commodity lost over 11% as the combination of a stronger greenback, rising supplies and weaker demand weighted on the price. Additionally, the first days of the new month have been very negative for oil investors. After the breakdown below the psychologically important barrier of $80, oil bears pushed the price lower and light crude hit a four-year low of $75.84, breaking under long-term support lines. In this way, the commodity posted its sixth weekly loss in a row. Will light crude drop any further in the nearest future? Is it possible that crude oil's ratios will give us some interesting clues?
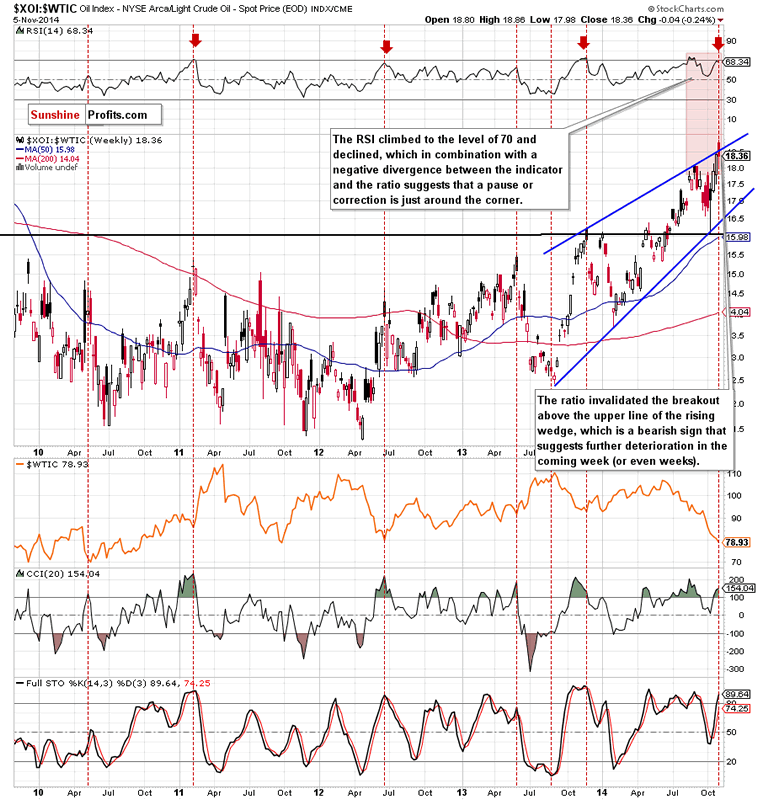
The first thing that catches the eye on the above chart is an invalidation of the breakdown above the upper line of the rising wedge. As you know, this is a strong bearish signal, which suggests further deterioration in the coming weeks. If this is the case, and we'll see a corrective move from here, the initial downside target will be the lower border of the formation. What does it mean for crude oil? When you take a closer look at the above chart, you will see that may times in the past local tops in the ratio have corresponded to the crude oil's lows. We saw such price actions in May 2010, Feb 2011, Jun 2012, May and Nov 2013. Additionally, the RSI climbed to the 70 level and declined - similarly to what we saw in the previous years. Back then, such a high reading on the RSI preceded a move down in the ratio and an upward move in crude oil. Taking these facts into account, and combining it with a negative divergence between the indicator and the ratio, we think that history will repeat itself once again and we'll see a corrective upward move in crude oil in the near future. When we factor in the position of the CCI, we clearly see that the indicator is overbought (and there is also a negative divergence), which is another bearish signal for the ratio.
Having say that, let's examine the relationship between the general stock market and crude oil to check if it confirms or invalidates the conclusions of the above analysis of the oil-stocks-to-oil ratio.
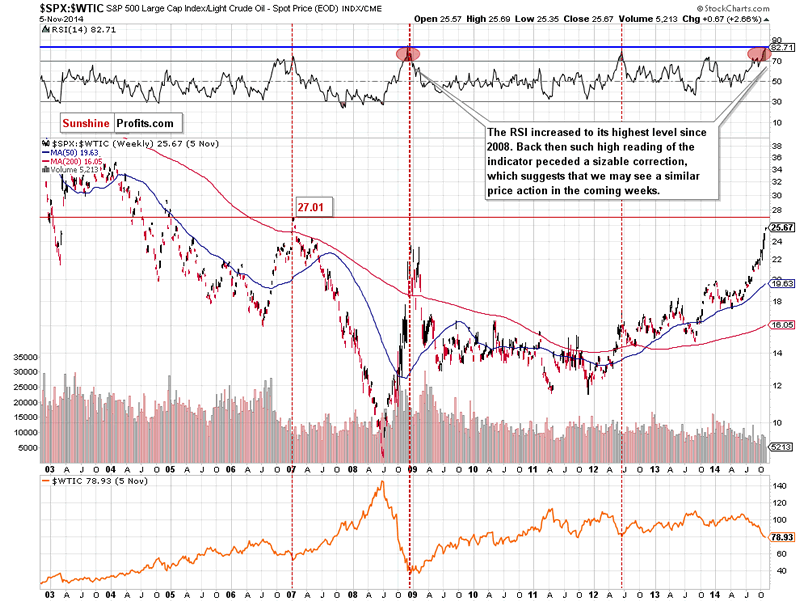
From this perspective, we see that similarly to what we saw in the case of the oil-stocks-to-oil ratio, there is a strong negative correlation between the ratio and the price of light crude. When we go back to 2007, we clearly see that the annual low in crude oil was preceded by the ratio's 2007 high. We could see this strong relationship also in 2009, when the annual low in crude oil corresponded to the ratio's 2009 high (marked with a red ellipse). We noticed similar price action also in Jun 2012 and Dec 2013. In all these cases, declines in the ratio triggered increases in light crude. As you see on the above chart, the space for further declines seems limited as the resistance level created by the 2007 high is close. Additionally, the RSI has reached its highest level since 2009. Back then, similar reading of the indicator triggered heavily declines in the ratio, which led to higher oil prices. Taking the above into account, we think that a trend reversal in the ratio is just around the corner and we will likely see improvement in crude oil.
Know the situation for the above ratios, let's move on to the non-USD (WTIC:UDN ratio) chart of crude oil. As a reminder, UDN is the symbol for the PowerShares DB US Dollar Index Bearish Fund, which moves in the exact opposite direction to the USD Index. Since the USD Index is a weighted average of the dollar's exchange rates with world's most important currencies, the WTIC:UDN ratio displays the value of crude oil priced in "other currencies".
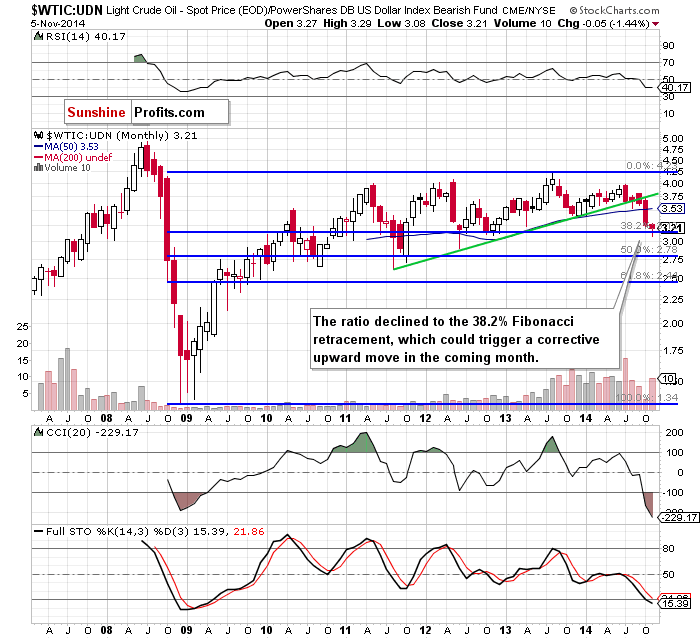
The above chart clearly shows that the recent declines took the ratio to slightly below the 38.2% Fibonacci retracement based on the entire 2008-2013 rally. As you see, this solid support stopped further deterioration (at least at the moment when these words are written) and triggered an upswing earlier this month, which invalidated the above-mentioned small breakdown. This is a positive signal (in our opinion, it would be even more bullish if the ratio closes the month above 3.15), which suggests that we could see a trend reversal in the coming month. If this is the case, we should also see a similar price action in the commodity.
Summing up, although crude oil rebounded sharply yesterday, the commodity still remains below the solid resistance zone, which could trigger another downswing in the coming days. Nevertheless, taking into account the current situation in the oil stocks-to-oil and stocks-to-oil ratios and combining it with an invalidation of the small breakdown below the 38.2% Fibonacci retracement (marked on the non-USD chart of crude oil), we think that the space for further declines is limited and a trend reversal in the case of the commodity is just around the corner.
The above article is based on our latest Oil Investment Update. Its full version includes much more details and is accompanied by scenario analysis and summary of key factors that are likely to affect crude oil in the coming weeks. If you enjoyed it, we encourage you to sign up for Oil Investment Updates or the Fundamental Package that includes it.
Thank you.
Nadia Simmons
Sunshine Profits‘ Contributing Author
Oil Investment Updates
Oil Trading Alerts
* * * * *
Disclaimer
All essays, research and information found above represent analyses and opinions of Nadia Simmons and Sunshine Profits' associates only. As such, it may prove wrong and be a subject to change without notice. Opinions and analyses were based on data available to authors of respective essays at the time of writing. Although the information provided above is based on careful research and sources that are believed to be accurate, Nadia Simmons and his associates do not guarantee the accuracy or thoroughness of the data or information reported. The opinions published above are neither an offer nor a recommendation to purchase or sell any securities. Nadia Simmons is not a Registered Securities Advisor. By reading Nadia Simmons’ reports you fully agree that he will not be held responsible or liable for any decisions you make regarding any information provided in these reports. Investing, trading and speculation in any financial markets may involve high risk of loss. Nadia Simmons, Sunshine Profits' employees and affiliates as well as members of their families may have a short or long position in any securities, including those mentioned in any of the reports or essays, and may make additional purchases and/or sales of those securities without notice.
© 2005-2022 http://www.MarketOracle.co.uk - The Market Oracle is a FREE Daily Financial Markets Analysis & Forecasting online publication.