


Stock Market Minor Correction Expected
Stock-Markets / Stock Markets 2014 Nov 10, 2014 - 10:04 AM GMTBy: Andre_Gratian

 Current Position of the Market
SPX: Long-term trend - Bull Market
Intermediate trend - Intermediate structure unclear
Analysis of the short-term trend is done on a daily basis with the help of hourly charts. It is an important adjunct to the analysis of daily and weekly charts which discusses the course of longer market trends.
MINOR CORRECTION EXPECTED
Market Overview
The outstanding characteristic of the rally from 1821 was its exceptional upside momentum. In the past week, that momentum slowed noticeably in some of the leaders (QQQ, Russell), but it was apparent in most of the indices. This should not be surprising since SPX has gone 210 points without a significant correction and it is more than overdue for a normal retracement of a couple of weeks' duration. This shift in momentum is best displayed in the most sensitive indicators and in the shorter time frames.
Momentum: With the index closing at an all-time high, the weekly MACD turned up a little more but still has not made a bullish cross, and it continues to exhibit significant negative divergence. The daily MACD remains positive and is still rising, but the histogram has been in a mild decline for the past four days. The hourly MACD peaked on 10/22 and has been in a decline ever since. It made another bearish cross on Friday.
Breadth: The McClellan Oscillator has remained bullish for the past month. This sustained bullishness has turned the Summation Index bullish as well and caused it to rise to a +275. Nevertheless, it remains in a declining mode with the last peak being near 600 and the one before over 1000.
Structure: The best two possibilities are: 1) we are still in primary wave IV, and 2) Primary wave III is extending. The market will eventually decide which of these is correct.
Accumulation/distribution: With the loss of momentum, a pattern of deceleration and distribution has reappeared in the SPX P&F chart.
VIX: The XIV managed to keep up with the SPX, giving it a neutral reading for the week. However, it remains in a position of severe divergence for the entire rally.
Cycles: "It is possible that the recent decline was only the work of the 4-year cycle and that the lows of the long-term Kress cycles are still ahead of us."
Some intermediate cycles were scheduled to start topping toward the end of last week and could be accounting for the loss of momentum. It is unclear at this time how much of an influence they will have on the market.
Chart Analysis
Our first chart will again be that of the weekly SPX (chart courtesy of QCharts, including others below) with the McClellan Summation Index posted underneath it.
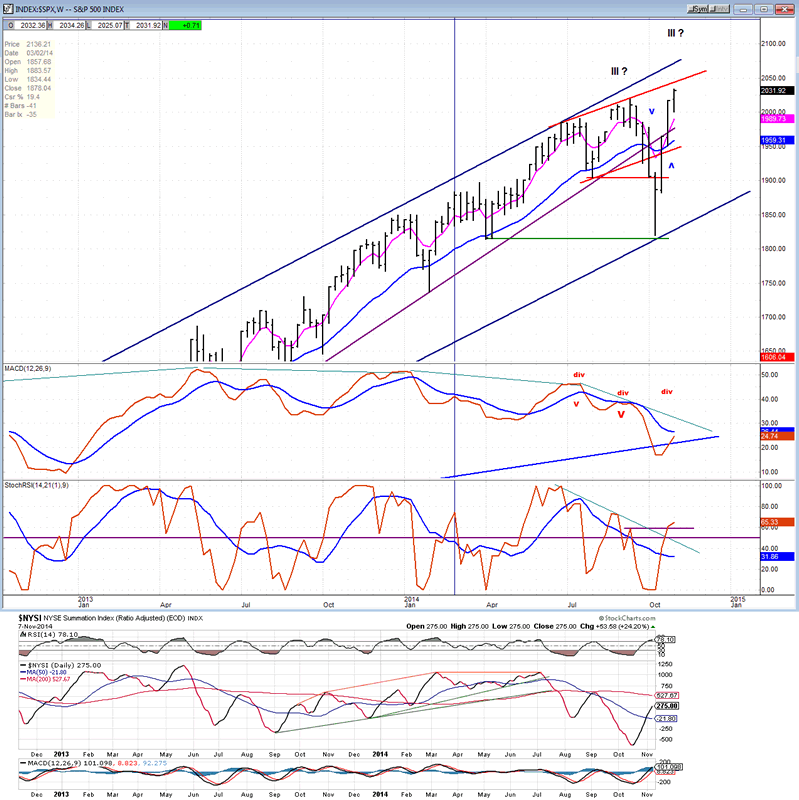
With the SPX closing at a new all-time high last week, price and indicators are back in an uptrend on the weekly chart. But the oscillators retain strong negative divergence and only one, the SRSI, has given a feeble buy signal -- its longer MA has barely managed to turn up. Even the Summation index which is benefitting from a strong oscillator reading is still in a downtrend and its RSI has reached overbought. The net picture is that of a strong deceleration in the overall weekly trend.
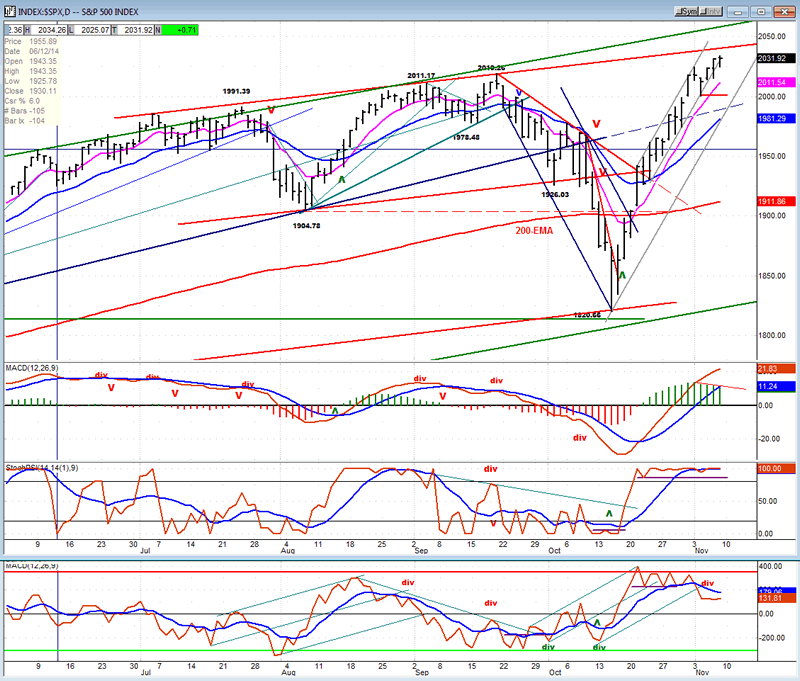
The daily SPX chart follows.
I have drawn a channel for the up move and I suspect that we will soon test the bottom channel line. The slowing of upside momentum is apparent on this chart. Prices had been hugging the top channel line until last week; they have pulled away and look ready for a minor correction.
The strong up-move has given us a strong MACD, but its histogram has started to correct and this should continue for a week or two. The SRSI is still flat-lining at the very top of its range and needs to start retracing. On the other hand, the A/D indicator has already started to diverge and to correct. This index is always the first to warn of a potential reversal in the trend.
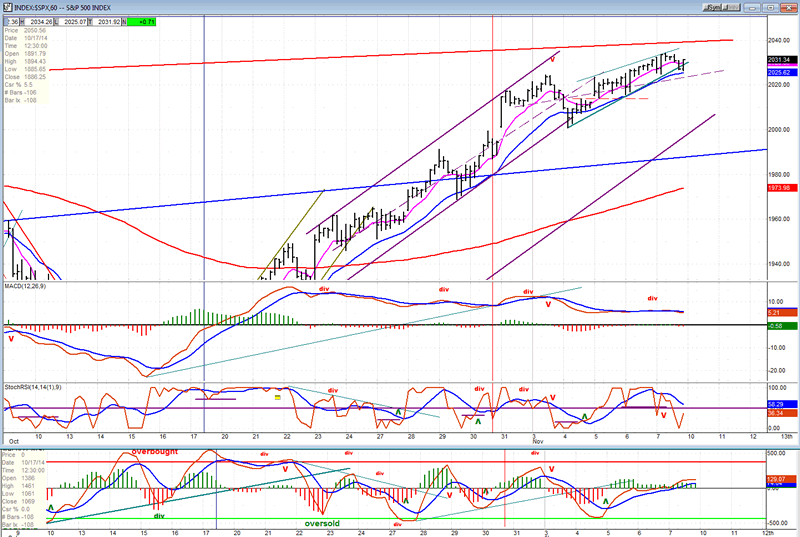
On the hourly chart we can see the ideal deceleration pattern which normally forms at the top of a rally in advance of a correction. The lower trend line was breached near the close on Friday, but the end-of-day short-covering took it back above the line.
The correction should have no problem going below the bottom channel line. The blue line represents the trend line from 1343 which was broken when the previous decline started, but the rally took prices back above it as if it did not even exist. Perhaps it will serve as temporary support for the correction which should go at least as low as the red 200-hr MA and quite possibly lower.
The MACD shows that the peak momentum was actually on the 22nd of last month. That's when it made its high and it has been declining since. Also, the SRSI is already in a short-term downtrend and the hourly A/D indicator is rolling over. The total picture given by the oscillators is that of an index which should waste no time rolling over; a weak opening on Monday is a pretty good bet.
Since this correction is ostensibly starting at the very top of some intermediate cycles, it could surprise those who expect only another shallow correction in a bull market. At least one seasoned cycle analyst believes that this could be an important top.
Sentiment Indicators
With the continuing rally in equities, the SentimenTrader (courtesy of same) long term indicator has moved back to 60, finally suggesting that sentiment has turned bearish. Sentiment displayed by Investors' Intelligence is far more bearish with 59.6% bullish and only 14.1% bearish.

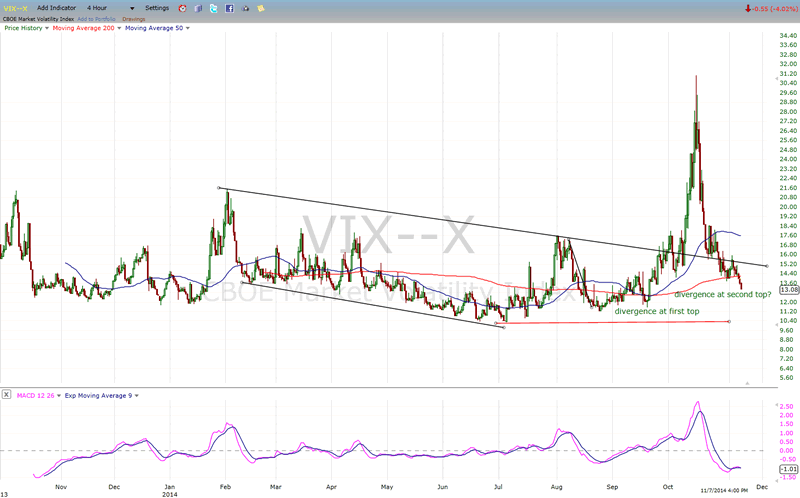
VIX (NYSE Volatility Index) - Leads and confirms market reversals.
VIX has pulled back a little more and dropped under its 200 DMA. However, it still retains positive divergence with the SPX and this is, in a sense, a non-confirmation of the new high. A better way to put it may be that it creates some doubt regarding how far the current rally can still expand.
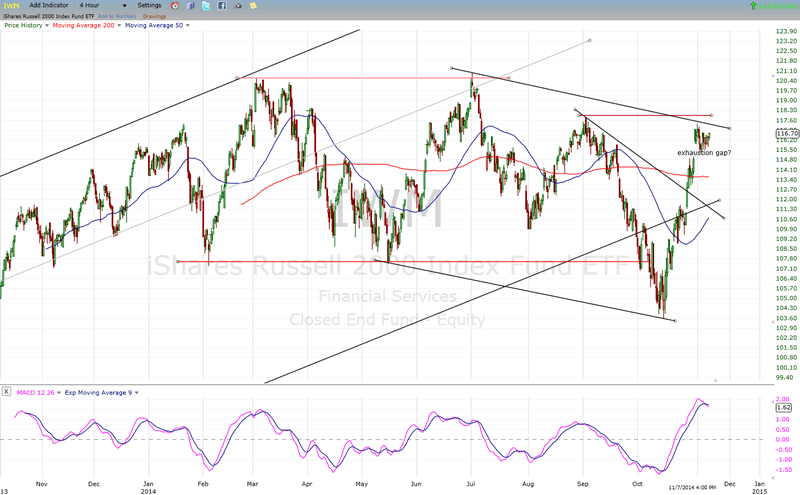
IWM (iShares Russell 2000) - Historically a market leader.
The Russell 2000's lack of participation this week points to the likelihood that a correction of sorts is coming. It is also important to note that it fell short of overcoming its previous high. Considering the cyclical configuration and other factors, we could be at an important inflection point.
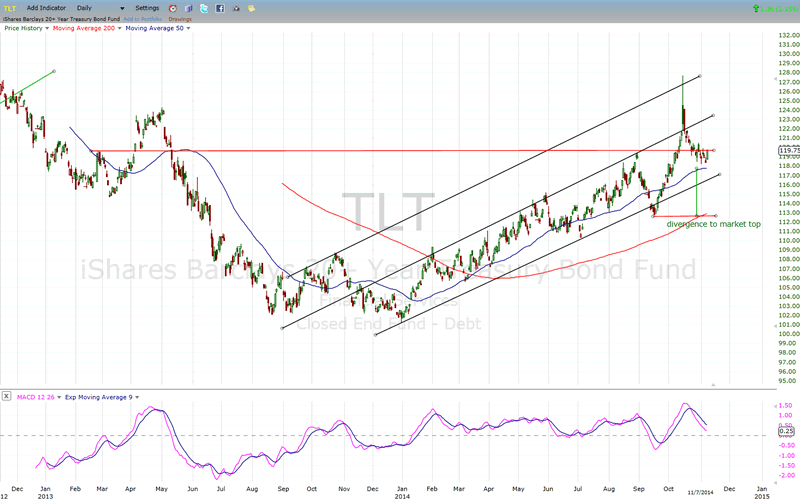
TLT (20+yr Treasury Bond Fund) - Normally runs contrary to the equities market.
TLT remains at a high level consolidation, which is bullish and intimates that a resumption of its advance may not be far away. That would, of course, coincide with a pull-back in equity prices.
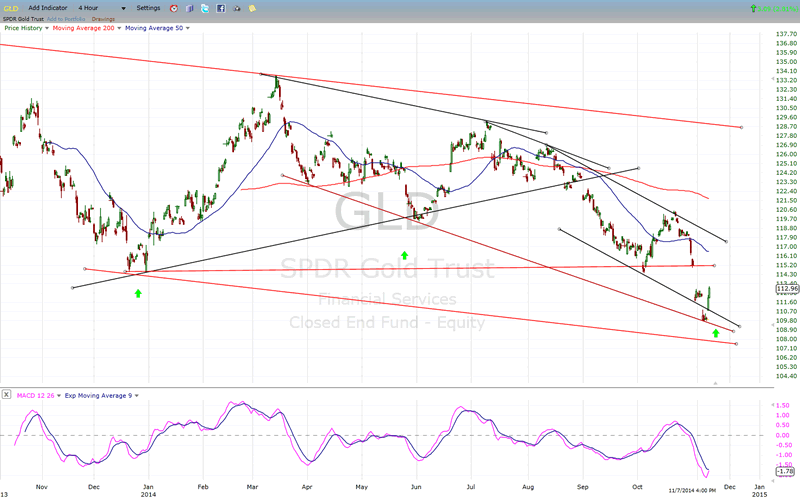
GLD (ETF for gold) - runs contrary to the dollar index.
GLD dropped down to its red channel line and rallied sharply for the first time in three weeks. This suggests that the 25-wk cycle might have made its low a little early. If so, a re-test of the low may take place before any further attempt at rallying. This rally should not be considered an important turn in the current long-term downtrend.
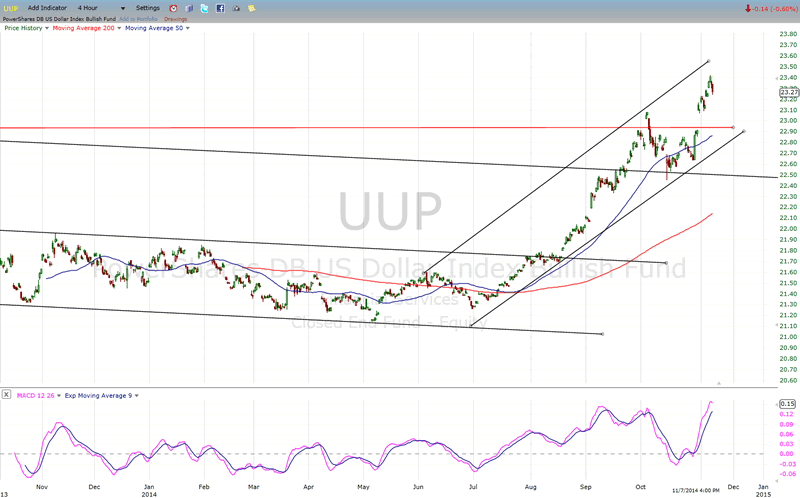
UUP (dollar ETF)
The rally in GLD was punctuated by a decline in the dollar which may still not have completed its 5th wave from the low. In that case, another small advance should be necessary before a larger corrrection takes place.
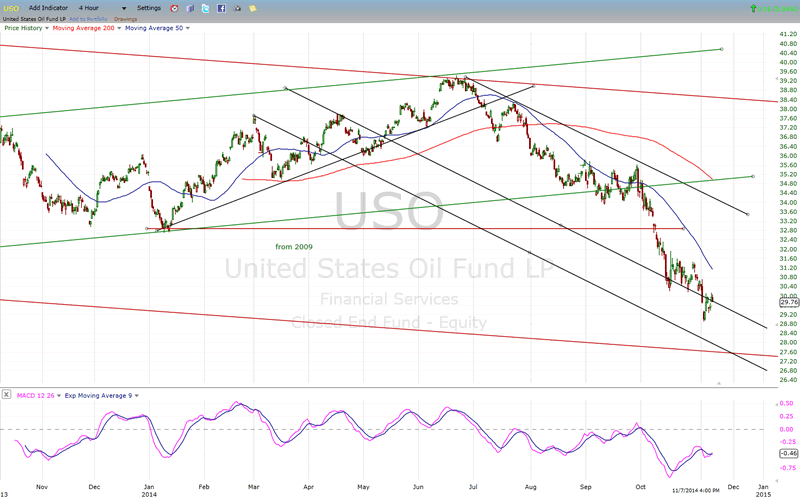
USO (US Oil Fund)
It is evident that the same 25-wk cycle is affecting USO as well. The retracement in UUP also caused a bounce in this index.
Summary
There are currently enough cross-currents in the stock market to create some uncertainty about its future direction. A rally with this kind of strength is not what the bears had expected, but now that the momentum appears to be waning, we need to start thinking about what kind of a pull-back we will get. In the last letter, I pointed out some troublesome, substantial intermediate to long-term negative divergences. Although some have improved slightly, they are not even close to going away.
Under the circumstances, it is best to give the market a little leeway to define its intermediate and long-term objectives. The short term forecast is a little easier to make: a consolidation or correction of a couple of weeks is likely.
FREE TRIAL SUBSCRIPTON
If precision in market timing for all time framesis something that you find important, you should
Consider taking a trial subscription to my service. It is free, and you will have four weeks to evaluate its worth. It embodies many years of research with the eventual goal of understanding as perfectly as possible how the market functions. I believe that I have achieved this goal.
For a FREE 4-week trial, Send an email to: ajg@cybertrails.com
For further subscription options, payment plans, and for important general information, I encourage
you to visit my website at www.marketurningpoints.com. It contains summaries of my background, my
investment and trading strategies, and my unique method of intra-day communication with
subscribers. I have also started an archive of former newsletters so that you can not only evaluate past performance, but also be aware of the increasing accuracy of forecasts.
Disclaimer - The above comments about the financial markets are based purely on what I consider to be sound technical analysis principles uncompromised by fundamental considerations. They represent my own opinion and are not meant to be construed as trading or investment advice, but are offered as an analytical point of view which might be of interest to those who follow stock market cycles and technical analysis.
Andre Gratian Archive |
© 2005-2022 http://www.MarketOracle.co.uk - The Market Oracle is a FREE Daily Financial Markets Analysis & Forecasting online publication.