


Stock Market Year End Rally
Stock-Markets / Stock Markets 2014 Nov 14, 2014 - 12:14 PM GMTBy: Puru_Saxena

 Although the Federal Reserve has now ended its quantitative easing (QE) program, the stock market has taken this in its stride and all eyes are now on the Fed Funds Rate, which will not be increased anytime soon. Make no mistake, the Federal Reserve has repeatedly stated that it will pursue an accommodative monetary policy for the foreseeable future and this suggests that the ongoing party on Wall Street will continue for as far as the eye can see. For sure, the primary uptrend will be punctuated by periodic pullbacks to the key moving averages, but the bull market will probably continue for at least another 2-3 years.
If you review Figure 1, you will note that the stock market's most recent pullback ended just under the 200-day moving average; and after Mr. Bullard's dovish comments, the S&P500 Index promptly reversed and it has now climbed above all the key moving averages. Furthermore, it is notable that the faster moving averages remain above the slower ones and this technical set up is typically seen during primary uptrends.
Figure 1: S&P 500 Index (daily chart)
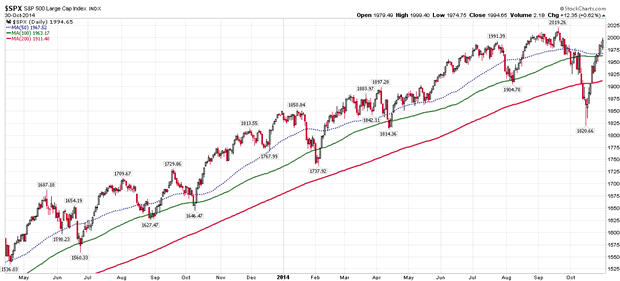
Source: www.stockcharts.com
Even though the primary trend is up, there can be no doubting the fact that we are now dealing with a mature bull. After all, the advance started in March 2009 so we are already in the 6th year of this bull market. Accordingly, over the following months, investors will need to remain extra vigilant and only allocate capital to the strong stocks and industry groups.
Unlike the early phase of a bull market, whereby every industry participates in the advance; during the mature phase, market breadth narrows and fewer and fewer stocks climb up the mountain. Therefore, going forwards, one will need to monitor the situation extremely closely and promptly liquidate all laggards from one's portfolio.
Turning to the current situation, is it noteworthy that the airlines, apparel, asset managers, auto parts, biotechnology, broker-dealers, restaurant and retail stocks are showing relative strength and we have allocated our portfolios to these areas. Conversely, agriculture, energy, industrials and materials related issues are underperforming the broad market and they should be avoided for now.
As far as the stock market's 'internal health' is concerned, we are pleased to report that the situation has improved markedly. For instance, after drying up temporarily, the number of new 52-week NYSE highs has surged and it now sits well above the number of new 52-week NYSE lows. Furthermore, after falling to below 30%, approximately 55% of the NYSE stocks are now trading above the 200-day moving average and this is yet another positive development.
Elsewhere, the NYSE Advance/Line is showing signs of strength and so far, we have not observed any negative divergence. Last but not least, after briefly dipping below its spring low, the Russell 2000 Growth Index has reversed course and it has now reclaimed the key moving averages (Figure 2).
Figure 2: Russell 2000 Growth Index (daily chart)
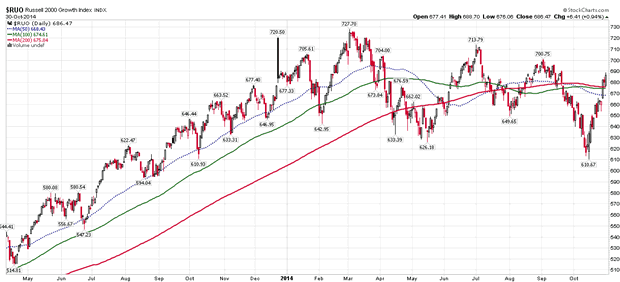
Source: www.stockcharts.com
From our perspective, additional strength in the Russell 2000 Growth Index will be good for the stock market and a close above the March high will open up the possibility of a major rally. Conversely, if this index loses steam and heads lower from these levels, it will be a red flag for the broad market.
Looking at the fundamentals, it is no secret that the world's major central banks remain in accommodative mode and although the Federal Reserve has ended QE, the European Central Bank (ECB) and Bank of Japan (BOJ) are still buying assets and this is a major plus for the stock market. As we have stated numerous times before, powerful bull markets do not end on their own, they are assassinated by the central banks. Therefore, as long as the bankers remain committed to reviving economic activity (credit growth) and they keep interest rates low, the path of least resistance for the stock market should remain up.
Turning to geographical exposure, we maintain our view that over the next 3-4 years, the developed world should continue to fare better than the emerging nations. Since April 2011, the stock markets of Europe, Japan and the US have done significantly better than the developing world and we believe that this relative outperformance is likely to persist for the foreseeable future. Although some of our readers may disagree with us, we are of the firm view that the developed economies are now healing and their recovering housing markets will eventually bring about prosperity.
It goes without saying, the biggest asset for most people is their home and when property prices appreciate, it brings about a tremendous 'wealth effect' which encourages spending and risk taking. When people feel richer and sentiment shifts for the better, borrowing and consumer spending pick up; and this re-ignites the economy (business activity). This is how the economic cycle works and in our opinion, the developed world's darkest days are now in the rear view mirror.
In case you are wondering whether the US economy has really improved since the financial crisis, look no further than Figure 3 which confirms that US corporate profits are now at a record high! So, despite all the 'gloom and doom' of the past few years, American corporations have performed exceptionally well.
Although we cannot guarantee the future, we do know that when the US housing market improves further, tremendous pent up demand will be unleashed and that will bring about an economic boom!
Figure 3: US corporate profits - record high!
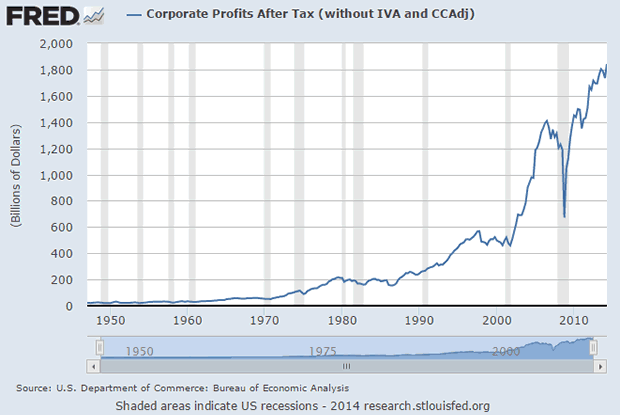
Source: St. Louis Fed
Elsewhere, with the ECB and BOJ now also expanding their balance-sheets and buying assets, it is only a matter of time before business activity revives in Europe and Japan.
Turning back to the stock market, it is our view that the lengthy consolidation phase in the Tokyo Nikkei Average is now complete and a significant rally is around the corner. Over in Europe, it appears to us as though the major stock markets have also bottomed out and a substantial rally is about to materialise. Accordingly, we have allocated some capital to these regions.
Last but not least, within the developing nations, we remain wildly optimistic about the Indian stock market and believe that it may turn out to be a star performer in 2015.
In summary, last month's stock market volatility is now over, prominent central banks are easing and the best phase of the US Presidential Cycle is right ahead of us. Consequently, we believe that the following months will be very good for common stocks and our equity and fund portfolios remain fully invested.
PRECIOUS METALS - We are not prophets, but we must admit that we called the entire bear market in the metals pretty accurately. You will recall that in late 2011, we opined that perhaps the metals had seen the secular top and we noted a massive distribution pattern in the Gold Bugs Index.
In 2012, we noted a series of lower highs in the metals and warned that a breach of the lows would trigger a waterfall decline. Sure enough, the metals did slice through the lows and we did get a panic fueled sell-off in spring 2013.
Thereafter, the metals consolidated for several months and throughout this base building period, we remained sceptical of the price action. Only in early 2014, did we briefly turn positive on gold but as soon as the 200-day moving average was breached, we recommended damage control. Throughout the summer months, we stated that the path of least resistance for the metals remained down and suggested that the next major move would be to the downside.
As it turns out, this is exactly how it played out!
If you review Figure 4, you will note that last month gold did slice through the key support level and it is currently trading below last year's low. Furthermore, it is worth mentioning that the yellow metal is now trading beneath the key moving averages, which are aligned in a typical bear market set-up.
Figure 4: Gold - looking extremely weak!
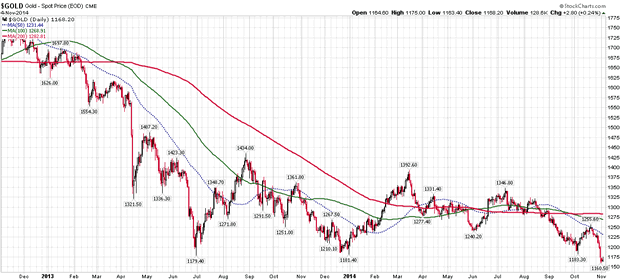
Source: www.stockcharts.com
Although we cannot guarantee the future, gold's price chart looks very weak and it appears as though we will get a sharp decline over the following weeks. Therefore, this is not the time to stand in harm's way and if anything, nimble traders can consider going 'short' the metal.
Turning to silver, it is noteworthy that its price has already breached the US$16 per ounce level and we suspect that the southbound journey will continue. Remember, precious metals are in a bear-market; therefore the major moves will be to the downside.
If the world's reserve currency continues to strengthen and capital flows towards productive assets, it is conceivable that the price of silver may even decline to US$10 per ounce. Accordingly, this is not the time to catch this falling knife and nimble traders can consider going 'short' the metal.
Finally, as far as the mining stocks are concerned, they have been a disaster and it seems as though the industry is heading towards major trouble!
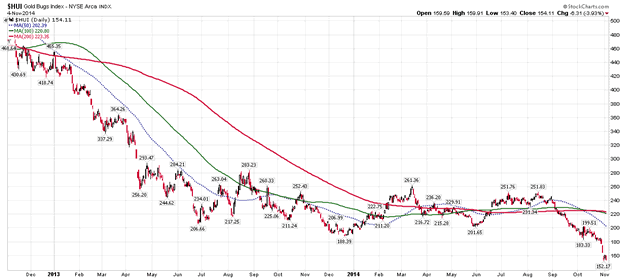
If you review Figure 5, you will see that after a horrific decline last year, the Gold Bugs Index has resumed its slide and it is currently trading beneath the key moving averages. More importantly, after a lengthy consolidation phase, the Gold Bugs Index has sliced through last year's low and this is a bearish omen.
Figure 5: Gold Bugs Index (daily chart)
Source: www.stockcharts.com
At present, the Gold Bugs Index is trading just above its low recorded in 2008; but we believe that it is probable that it will eventually fall below that level. When that happens, many mining companies will get into serious financial trouble and numerous 'juniors' will go bankrupt. Accordingly, we do not have any exposure to this sector and recommend that our readers stay well clear of the miners.
Puru Saxena publishes Money Matters, a monthly economic report, which highlights extraordinary investment opportunities in all major markets. In addition to the monthly report, subscribers also receive “Weekly Updates” covering the recent market action. Money Matters is available by subscription from www.purusaxena.com.
Puru Saxena
Website – www.purusaxena.com
Puru Saxena is the founder of Puru Saxena Wealth Management, his Hong Kong based firm which manages investment portfolios for individuals and corporate clients. He is a highly showcased investment manager and a regular guest on CNN, BBC World, CNBC, Bloomberg, NDTV and various radio programs.
Copyright © 2005-2014 Puru Saxena Limited. All rights reserved.
Disclaimer: The above is a matter of opinion provided for general information purposes only and is not intended as investment advice. Information and analysis above are derived from sources and utilising methods believed to be reliable, but we cannot accept responsibility for any losses you may incur as a result of this analysis. Individuals should consult with their personal financial advisors.© 2005-2022 http://www.MarketOracle.co.uk - The Market Oracle is a FREE Daily Financial Markets Analysis & Forecasting online publication.