How Inflation Changes Retirement Benefit Choices
Personal_Finance / Inflation Dec 17, 2014 - 06:03 PM GMTBy: Dan_Amerman
 One of the most important financial questions someone of retirement age in the United States faces is when to start collecting their Social Security payments ─ and this crucial decision deserves the best possible information to work from.
Recently, there has been quite a bit of publicity about studies showing that for a retiree who lives to an average age, there is a six figure advantage to waiting until age 70 to begin the collection of Social Security payments. That is an amazing advantage ─ but does it hold up under close scrutiny?
As we will explore herein, once we "raise our game" a bit, and use a more sophisticated type of financial analysis than some of the very simple Social Security decision aids in wide circulation ─ the results can turn upside down. That is, for many millions of people, the financial case for early collection of benefits is much stronger than is commonly recognized.
Now, having this more accurate financial information does not by itself answer the question, given that there are many other factors involved, including the crucial unknown factor of lifespan. That said, better choices can still be made.
Level One: Simple Dollar Analysis
Beginning at age 62, those eligible for Social Security have a right to collect benefits, but they are also given a strong financial incentive by the government to not exercise that right. They can choose to begin collecting benefits immediately, but the benefits are relatively low and will remain so for the rest of one's life. The incentive for not starting immediately is that the longer one waits to start collecting benefits, the higher the benefits that will be paid out each month, and again – this is for life.

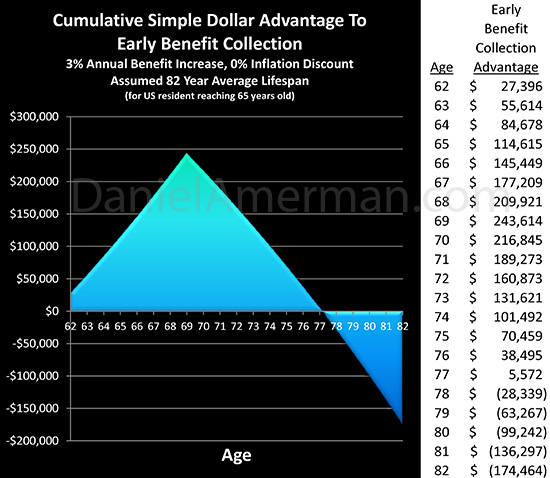
The above graph and table represent the financial choices presented to an individual who has just turned 62, and is deciding between collecting $2,283 dollars a month starting right then, or waiting until age 70 when the scheduled payments should be $4,044 per month – or a full 77% increase over early collection. (There are many factors involved in what the actual payments will be, but we are keeping it as simple as we can with just those two decision points to consider. Your personal situation will naturally be different, possibly very different.)
As shown, if one begins collection early, then the cash flow advantage builds over time, as more and more payments are received. Also, once per year, monthly payments are assumed to adjust upwards by 3%, as the government increases the checks to keep up with an assumed 3% rate of inflation. (With this simple dollar methodology, payments rise with inflation, but are not discounted for inflation. More on that in Level Two.)
So long as the choice is between some money coming in versus no money coming in – there is obviously an overwhelming advantage to having some money coming in, which builds, until by the end of one's 69th year there is almost a quarter million dollar advantage to early collections. And of course this advantage is particularly great for those who don't make it to their 70th birthday, or don't live very long beyond that.
On the other hand, for the substantial majority of retirees who do live at least that long and much longer – from that day forward there is a powerful monthly financial advantage to having waited. The much bigger checks immediately begin to reduce the cumulative advantage to having collected the smaller checks for a longer period, and the dollar advantage plunges downward in both chart and table. Until at the age of 78 years and 1 month we reach our crossover date, whereby the dollar advantage to early Social Security benefit collection disappears entirely.
For someone who reaches the age of 65, the average lifespan is 82 years. And as indicated, for the entire time between our crossover age of 78 years and 1 month, and an assumed end to benefit collection at the end of the 82nd year, the cumulative dollar advantage of about $175,000 goes to those who waited to collect their payments.
This particular kind of Social Security analysis is responsible for the widely reported, headline-grabbing conclusion that for those retirees who live to an average age, there is a six figure advantage to waiting until age 70 to collect benefits, with couples having a much bigger advantage over individuals. As presented, that is quite an advantage, and millions of people are being urged to use this kind of financial education – which points towards deferring the collection of their Social Security benefits – in order to make the best possible decisions.
Level Two: Spending Power Analysis
There is unfortunately a fundamental flaw with these calculations, which becomes apparent when we raise the sophistication of our analysis by just one notch.
The problem with the Level One analysis is that it looks at the future in terms of simply "dollars", which is also the unquestioned norm for newspapers and television and the like. So to be fair, this simple form of analysis ─ which is based upon "a dollar being a dollar", regardless of when we receive it ─ does indeed fall within the normal range of how financial information is presented to the general public, and the assertion of a six figure simple dollar advantage is mathematically accurate.
However, when we look at the future in terms of spending power (otherwise known as using inflation-adjusted dollars) – as those with a reasonable amount of financial or economic training usually do – we discover a surprisingly different outcome.
For when we get inflation adjustments to our salary or retirement benefits, while on the surface it may seem like we're getting a raise, we're actually not – rather we're being compensated for the loss of the purchasing power of our dollars.
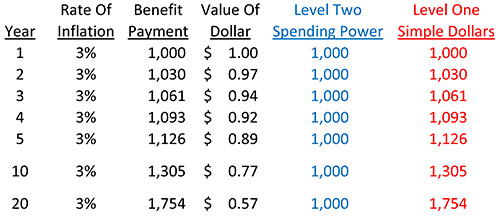
This issue is illustrated in the table below, which shows the effects of a 3% rate of inflation on a $1,000 benefit payment, that exactly keeps up with the rate of inflation. We do get more dollars each year, as seen in the "Benefit Payment" column. However, the dollar buys less each year, as shown in the "Value Of Dollar" column.

So if in the interests of making the best decision for our retirements we want to get an accurate look over time at what matters – which is the purchasing power of our benefit check – then an evaluation method used by professional analysts is to adjust the amount of each payment for the value of the dollar at the time, which produces our "Level Two Spending Power" column. And indeed, a benefit payment which exactly keeps up with inflation should maintain an exactly level purchasing power.
However, the common "Simple Dollars" approach of Level One ignores purchasing power, thus making it look like we earn more money each year, and the further out we go in time – the greater the advantage. So naturally, this favors payments that arrive later in time over earlier payments. Unfortunately, however, this is the exact opposite of how inflation really works, which is that the sooner we get a dollar, the more valuable it is to us.
So what happens if we do look at our pivotal decision about when to begin collecting benefits in spending power terms?

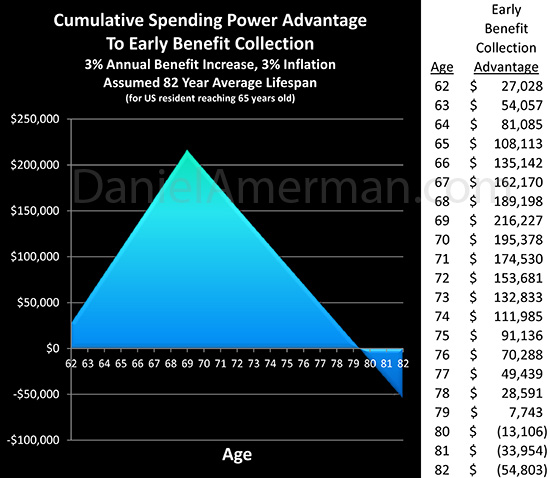
As shown in the above graph – the results are remarkably different. Our "crossover date" when the financial advantage goes with delaying our Social Security checks moves to 80 years and 5 months – a delay of 2 years and 4 months. And the triangle on the bottom that represents the financial advantage to waiting is a small fraction of the size indicated at Level One.
What this means is that more than two thirds of the headline-grabbing six figures advantage to deferring Social Security benefits just vanished. So for someone who has reached retirement age, and then lives to an average age in retirement, the advantage has shrunk from about $175,000 to a much less impressive $55,000.
As can be seen, then, the problem with the widely-used Level One approach for making Social Security decisions is that a six figure illusion is created when it comes to what matters most – what our money will buy for us.
Level Three: Separating Inflation From Benefit Increases
We're not done yet, however, because we have another crucial level of financial reality to consider. Which is that particularly since the Financial Crisis of 2008 and the ensuing Great Recession – the annual increases in payments to Social Security beneficiaries have not been keeping up with the rate of inflation.
Let's also consider the fact that the heavily-indebted US government has some major financial problems. We should thus allow for the possibility that Social Security payment increases may continue to be less than the rate of inflation for potentially decades. How does that affect our decision?
The second half of this article is linked below, and includes two additional analyses of retirement benefit choices. There is an examination of what happens with each choice when benefits don't keep up with inflation, as well the choice and retirement impact if a deeply indebted government increases the rate of inflation, while keeping benefit increases low.
Daniel R. Amerman, CFA
Website: http://danielamerman.com/
E-mail: mail@the-great-retirement-experiment.com
Daniel R. Amerman, Chartered Financial Analyst with MBA and BSBA degrees in finance, is a former investment banker who developed sophisticated new financial products for institutional investors (in the 1980s), and was the author of McGraw-Hill's lead reference book on mortgage derivatives in the mid-1990s. An outspoken critic of the conventional wisdom about long-term investing and retirement planning, Mr. Amerman has spent more than a decade creating a radically different set of individual investor solutions designed to prosper in an environment of economic turmoil, broken government promises, repressive government taxation and collapsing conventional retirement portfolios
© 2014 Copyright Dan Amerman - All Rights Reserved
Disclaimer: This article contains the ideas and opinions of the author. It is a conceptual exploration of financial and general economic principles. As with any financial discussion of the future, there cannot be any absolute certainty. What this article does not contain is specific investment, legal, tax or any other form of professional advice. If specific advice is needed, it should be sought from an appropriate professional. Any liability, responsibility or warranty for the results of the application of principles contained in the article, website, readings, videos, DVDs, books and related materials, either directly or indirectly, are expressly disclaimed by the author.
© 2005-2022 http://www.MarketOracle.co.uk - The Market Oracle is a FREE Daily Financial Markets Analysis & Forecasting online publication.


