


Stocks Bull Market Resumes
Stock-Markets / Stock Markets 2014 Dec 20, 2014 - 09:04 PM GMTBy: Tony_Caldaro

 Another wild week in the markets. The market opened the week at SPX 2002 after last week’s 3.5% selloff. After a gap up opening on Monday carrying the SPX to 2019, it gapped down on Tuesday hitting 1973 right at the close. After that the market gapped up Wednesday, and on Thursday, then came with one point of its all time high on Friday. For the week the SPX/DOW gained 3.2%, the NDX/NAZ gained 2.2%, and the DJ World index was up 2.2%. Economic reports for the week were slightly biased to the downside. On the uptick: industrial production, capacity utilization, housing starts, leading indicators and weekly jobless claims improved. On the downtick: the NY/Philly FED, the NAHB, building permits, the CPI, and the WLEI. Next week, a holiday shortened week, we get Q3 GDP, PCE prices, and more reports on housing. Best to your holiday week!
LONG TERM: bull market
As we enter the last two weeks of 2014, a look back displays quite a choppy year. For example, in 2012 we had just 4 trend reversals for the entire year. Then in 2013 the same, just 4 trend reversals. In 2014, however, there has been 9 trend reversals with a possible 10th one on the way. A traders delight, but a most difficult one to track with Elliott Waves. The year started at SPX 1848, ticked up to 1850, then the first week was down and the month was down. So much for the January effect, as the market currently looks to gain about 12% this year.
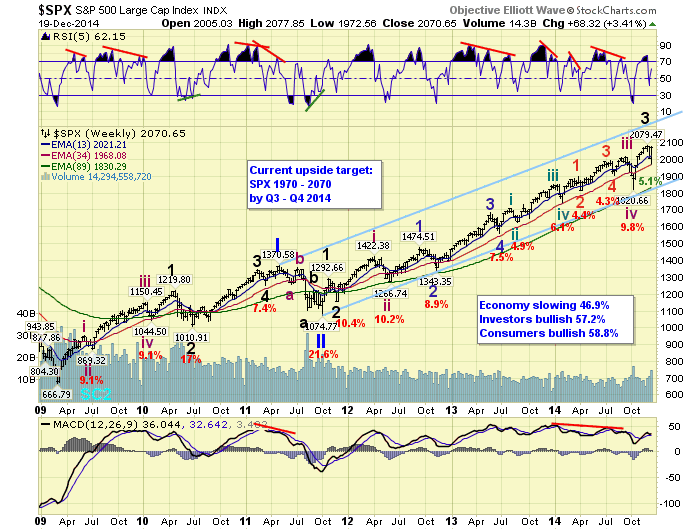
We continue to count this 69 month bull market as Cycle wave [1] of SC 3. Cycle wave bull markets unfold in five Primary waves. From the March 2009 low, Primary waves I and II completed two years later in 2011. At the October 2011 low Primary wave III began, and has been unfolding ever since. While Primary I was relatively simple with only 9 waves. Primary III has been extraordinary to say the least, as it is nearly 21 waves long, and has travelled nearly 43% further in points. While Primary I had a subdividing Major wave 1, and simple Major waves 3 and 5. Primary III had a simple Major wave 1, a very long subdividing Major 3, and possibly will have a subdividing Major wave 5 as well. Yes, Primary wave III may last for quite a while longer.
However, before we get too far ahead of ourselves we must note that we are still carrying three potential counts. The one we prefer, with a 50% probability, that is posted in this update. One count posted on the DOW charts, which we give a 30% probability. And the third posted on the NAZ charts which we give a 20% probably. The recent market action has done nothing yet to change, nor eliminate, any other these counts.
MEDIUM TERM: uptrend probable
After identifying the September Int. wave iii uptrend high right at the 2019 pivot. We identified the downtrend low within the range of the 1828 pivot, when the downtrend characteristics changed. As it turned out that uptrend took the market to new highs, but we again identified the next uptrend high within the range of the 2085 pivot. The selloff that followed could have been a 5%, 10% or 20% correction. On Tuesday, at the low, we noted the minimum parameters had been met for the 5% correction. Then on Wednesday the market characteristics changed within the first few hours of trading. After that the market took off to the upside, nearly reaching its all time high in the last hour of trading on Friday. The market had bottomed right at the 1973 pivot.
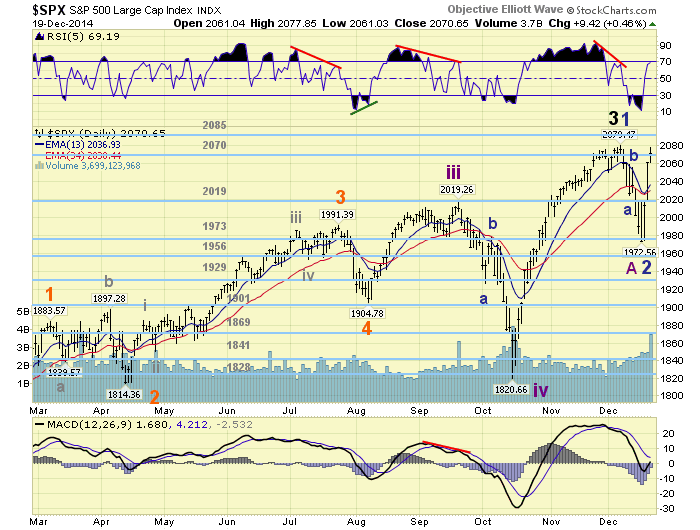
Pending the extent of the December correction we suggested either Int. v/Major 3 had ended at SPX 2079, or only Minor wave 1 of a subdividing Int. wave v. Just a glance at the weekly chart will display just how much Int. wave iii subdivided, and even Minor 5 of Int. iii. Since mid-2013 this market has had a number of 4% to 5% corrections. We counted the downtrend as a double zigzag on the hourly chart, but it was actually more complex than that using the lower time frames. We are currently still carrying both potential counts pending an uptrend confirmation. Probabilities suggest a subdivision of Intermediate wave v is underway. Medium term support is at the 2070 and 2019 pivots, with resistance at the 2085 and 2131 pivots.
SHORT TERM
During the recent downtrend we counted the decline from SPX 2079 to 1973 as a double zigzag. The first zigzag did look like a 5-3-5, but the second zigzag was actually a series of zigzags within itself. Quite a complex pattern. Nevertheless, coming off the SPX 1973 low we observed a small five waves up to 2012: 1989-1979-2000-1990-2012. Then after a pullback to SPX 1992 we observed a larger five waves up: 2047-2033-2071-2062-2078 on Friday. With this market quite overbought, after rallying 105 points in just three days, and displaying a slight short term negative divergence, we “could” see a sizeable pullback (30 points more or less) early next week. If the market starts making higher highs, this five wave advance “could” be extending. So a drop below SPX 2062 suggests lower, and a rise above 2078 suggests higher.
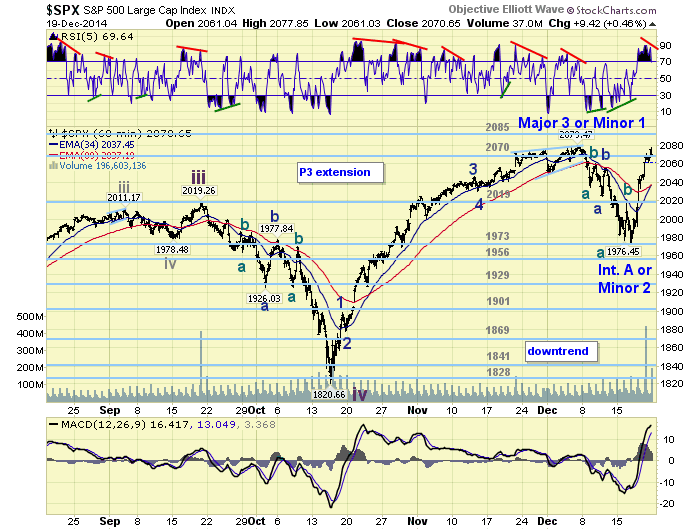
Currently we are labeling the first five waves up Micro wave 1, and this second five up Micro wave 3 of the first of five Minute waves in this potential uptrend. Since there is not much room on the hourly chart to post these labels we will verbally keep you informed as the market progresses. The implications of a subdividing Intermediate wave v, into five Minor waves, are quite bullish. Since the last uptrend travelled 258 points, this uptrend could travel about 258 points as well. For now, our uptrend target, once this rally confirms and uptrend, is the 2214 pivot. The next pivot above 2131. This would suggest an uptrend slightly shorter than the last: between 234 to 248 points. More details to follow once the uptrend is confirmed. Short term support is at the 2070 and 2019 pivots, with resistance at the 2085 and 2131 pivots. Short term momentum displays a slight negative divergence.
FOREIGN MARKETS
The Asian markets were mixed on the week but gained 0.9%.
The European markets were all higher and gained 2.7%.
The Commodity equity group were mixed but gained 1.5%.
The DJ World index gained 2.2% on the week.
COMMODITIES
Bonds are still downtrending and lost 0.3% on the week.
Crude is still downtrending and lost 1.0% on the week.
Gold remains in an uptrend but lost 2.3% on the week.
The USD just keeps extending its uptrend gaining 1.7% on the week.
NEXT WEEK
Monday: Existing home sales at 10am. Tuesday: Q3 GDP (est. +4.2%), Durables goods orders, the FHFA index, Consumer sentiment, Personal income/spending, PCE prices and New home sales. Wednesday: weekly Jobless claims, and the market closes at 1pm. Thursday: Holiday. Friday: normal trading hours. Best to your weekend and week, plus Happy holidays!
CHARTS: http://stockcharts.com/public/1269446/tenpp
http://caldaroew.spaces.live.com
After about 40 years of investing in the markets one learns that the markets are constantly changing, not only in price, but in what drives the markets. In the 1960s, the Nifty Fifty were the leaders of the stock market. In the 1970s, stock selection using Technical Analysis was important, as the market stayed with a trading range for the entire decade. In the 1980s, the market finally broke out of it doldrums, as the DOW broke through 1100 in 1982, and launched the greatest bull market on record.
Sharing is an important aspect of a life. Over 100 people have joined our group, from all walks of life, covering twenty three countries across the globe. It's been the most fun I have ever had in the market. Sharing uncommon knowledge, with investors. In hope of aiding them in finding their financial independence.
Copyright © 2014 Tony Caldaro - All Rights Reserved Disclaimer: The above is a matter of opinion provided for general information purposes only and is not intended as investment advice. Information and analysis above are derived from sources and utilising methods believed to be reliable, but we cannot accept responsibility for any losses you may incur as a result of this analysis. Individuals should consult with their personal financial advisors.
Tony Caldaro Archive |
© 2005-2022 http://www.MarketOracle.co.uk - The Market Oracle is a FREE Daily Financial Markets Analysis & Forecasting online publication.