


Gold Price Looks Ready to Go Higher from Here
Commodities / Gold and Silver 2015 Jan 04, 2015 - 12:52 PM GMTBy: MarketsToday

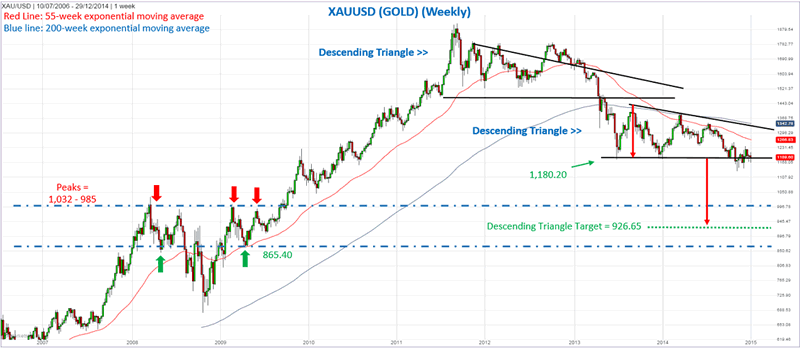
 The big picture in Gold hasn’t changed much over the past month. For approximately nine weeks now Gold has been consolidating around prior support of 1,182.20, a price first hit back in June of 2013. This price area was then tested as support first in December 2013, then more recently in May 2014. During that 16-month time frame Gold consolidated forming a bearish descending triangle pattern. It broke out to the downside nine weeks ago. However, there has been no follow through as it bounced off 1,132.08 and has crept higher since, closing at 1,189.60 last week.
Gold Analysis Chart
This leads one to suspect that Gold could rally higher before going lower, if it is to eventually go lower. In this regard it is interesting to note that on the monthly chart Gold dropped below its 55-month exponential moving average (ema) in June 2013 for the first since January 2002. During the formation of the triangle the 55-month ema area was tested as resistance a number of times. Being a significant long-term trend indicator, this is considered a bearish sign.
Gold analysis chart
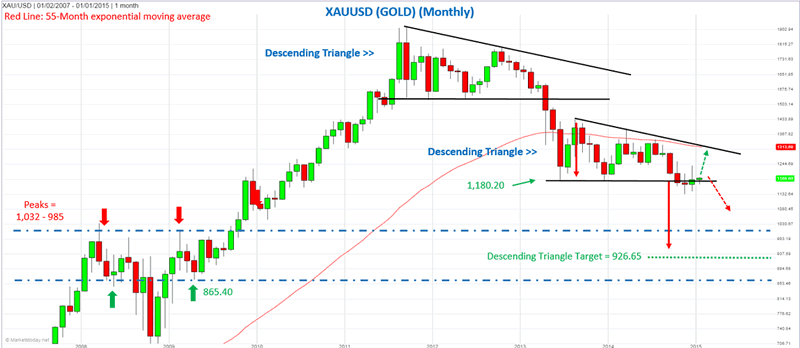
In the near-term, a further bounce back up into the triangle formation and a test of resistance is possible. Trade above and a close above the recent swing high of 1,255.3 will give a bullish trend continuation signal on the daily chart, while a bullish trend continuation signal occurs on the monthly chart on a move above 1,238.3.
Gold Analysis Chart
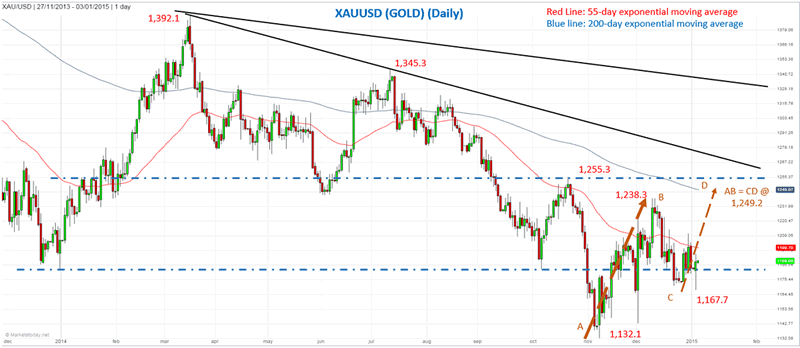
Lower down, a short-term bearish AB=CD pattern at 100% completes at 1,249.2. If Gold holds above the most recent swing low of 1,167.7, the odds favor a rally into at least the 1,249 price area. It could then see at least a short-term decline from there.
About MarketsToday.net: MarketsToday.net® is an online financial portal covering the Middle East stock markets, plus spot Forex, oil, and precious metals, published in both Arabic and English. It is designed to help keep investors and traders up-to-date with the latest news, quotes, performance trends, and market developments in the Middle East stock markets.
Copyright 2014 © MarketsToday - All Rights Reserved
Disclaimer: The above is a matter of opinion provided for general information purposes only and is not intended as investment advice. Information and analysis above are derived from sources and utilising methods believed to be reliable, but we cannot accept responsibility for any losses you may incur as a result of this analysis. Individuals should consult with their personal financial advisors.
© 2005-2022 http://www.MarketOracle.co.uk - The Market Oracle is a FREE Daily Financial Markets Analysis & Forecasting online publication.