Most Popular
1. It’s a New Macro, the Gold Market Knows It, But Dead Men Walking Do Not (yet)- Gary_Tanashian
2.Stock Market Presidential Election Cycle Seasonal Trend Analysis - Nadeem_Walayat
3. Bitcoin S&P Pattern - Nadeem_Walayat
4.Nvidia Blow Off Top - Flying High like the Phoenix too Close to the Sun - Nadeem_Walayat
4.U.S. financial market’s “Weimar phase” impact to your fiat and digital assets - Raymond_Matison
5. How to Profit from the Global Warming ClImate Change Mega Death Trend - Part1 - Nadeem_Walayat
7.Bitcoin Gravy Train Trend Forecast 2024 - - Nadeem_Walayat
8.The Bond Trade and Interest Rates - Nadeem_Walayat
9.It’s Easy to Scream Stocks Bubble! - Stephen_McBride
10.Fed’s Next Intertest Rate Move might not align with popular consensus - Richard_Mills
Last 7 days
S&P Stock Market Trend Forecast to Dec 2024 - 16th Apr 24
No Deposit Bonuses: Boost Your Finances - 16th Apr 24
Global Warming ClImate Change Mega Death Trend - 8th Apr 24
Gold Is Rallying Again, But Silver Could Get REALLY Interesting - 8th Apr 24
Media Elite Belittle Inflation Struggles of Ordinary Americans - 8th Apr 24
Profit from the Roaring AI 2020's Tech Stocks Economic Boom - 8th Apr 24
Stock Market Election Year Five Nights at Freddy's - 7th Apr 24
It’s a New Macro, the Gold Market Knows It, But Dead Men Walking Do Not (yet)- 7th Apr 24
AI Revolution and NVDA: Why Tough Going May Be Ahead - 7th Apr 24
Hidden cost of US homeownership just saw its biggest spike in 5 years - 7th Apr 24
What Happens To Gold Price If The Fed Doesn’t Cut Rates? - 7th Apr 24
The Fed is becoming increasingly divided on interest rates - 7th Apr 24
The Evils of Paper Money Have no End - 7th Apr 24
Stock Market Presidential Election Cycle Seasonal Trend Analysis - 3rd Apr 24
Stock Market Presidential Election Cycle Seasonal Trend - 2nd Apr 24
Dow Stock Market Annual Percent Change Analysis 2024 - 2nd Apr 24
Bitcoin S&P Pattern - 31st Mar 24
S&P Stock Market Correlating Seasonal Swings - 31st Mar 24
S&P SEASONAL ANALYSIS - 31st Mar 24
Here's a Dirty Little Secret: Federal Reserve Monetary Policy Is Still Loose - 31st Mar 24
Tandem Chairman Paul Pester on Fintech, AI, and the Future of Banking in the UK - 31st Mar 24
Stock Market Volatility (VIX) - 25th Mar 24
Stock Market Investor Sentiment - 25th Mar 24
The Federal Reserve Didn't Do Anything But It Had Plenty to Say - 25th Mar 24

Market Oracle FREE Newsletter

How to Protect your Wealth by Investing in AI Tech Stocks

Trading Markets - 3 Ways to Identify Support and Resistance - 5 Chart Examples

InvestorEducation / Learn to Trade Jan 08, 2015 - 11:19 AM GMT

By: EWI

InvestorEducation

Today's lesson considers three ways to identify price support and resistance in the markets you trade.

  1. Previous highs and lows
  2. Trendline support
  3. Fibonacci Ratios

These examples are adapted from Jeffrey Kennedy's Trader's Classroom service.


1) Uptrends terminate at resistance while downtrends terminate at support. Previous highs and lows often act as resistance and support.

In ALCOA Inc (AA), the September 2012 selloff found support near the previous July 2012 low.

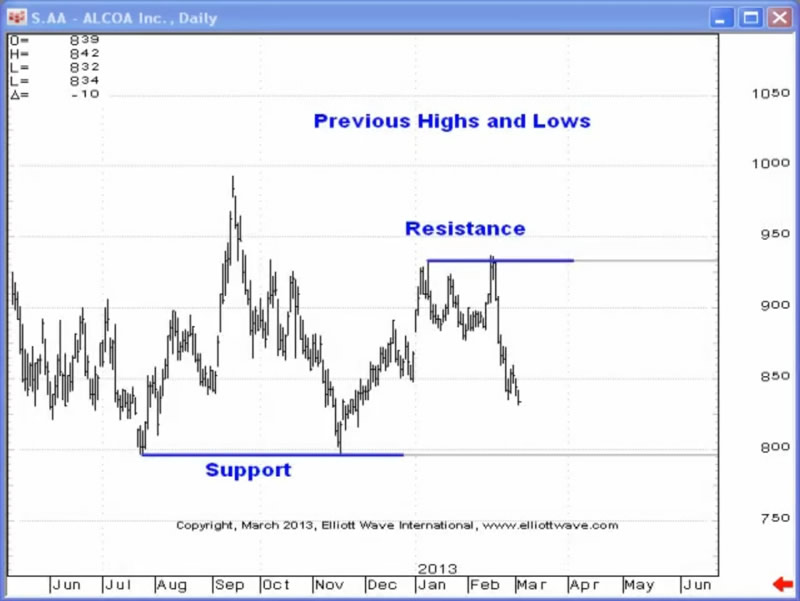
The February 2013 peak occurred following a test of resistance at the January peak at $9.33.

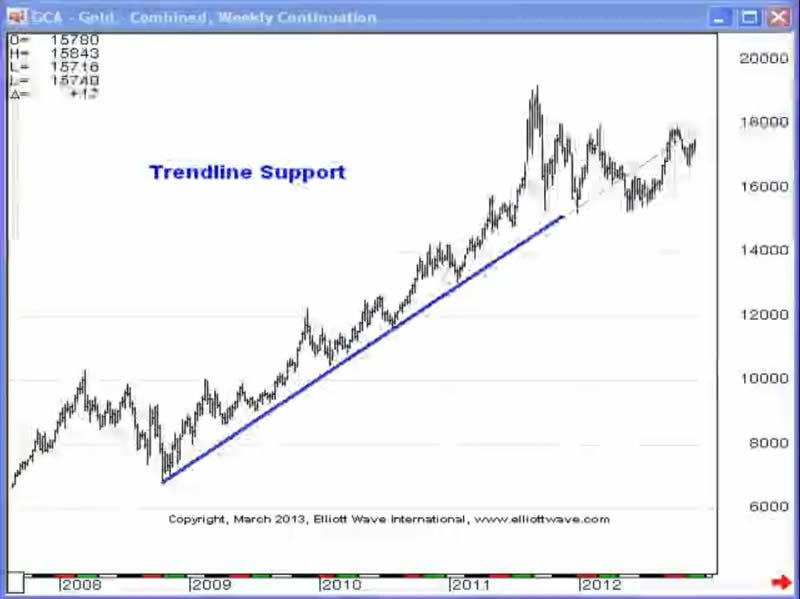
2) Trendlines offer resistance and support for prices.

The 2008 advance in Gold found support numerous times near the trendline that connected the lows of the move, as you can see below:

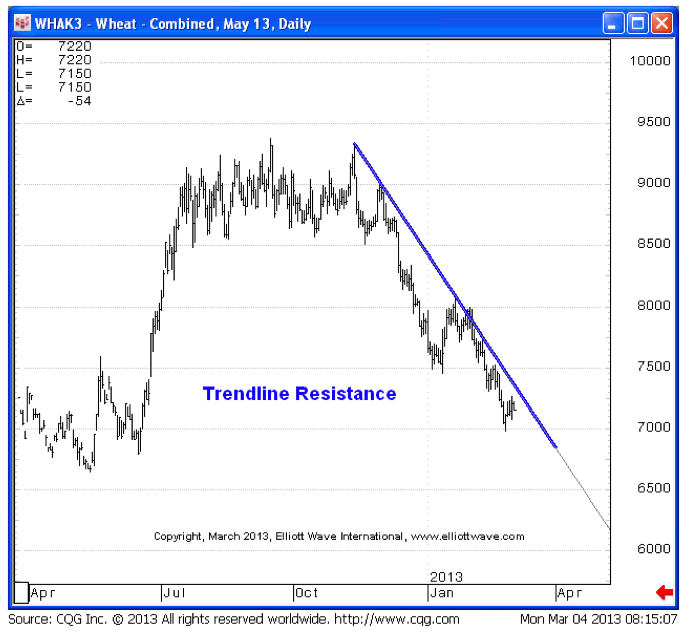
Conversely, the trendline connecting the highs of Wheat's 2012-2013 decline provided resistance for countertrend price action.

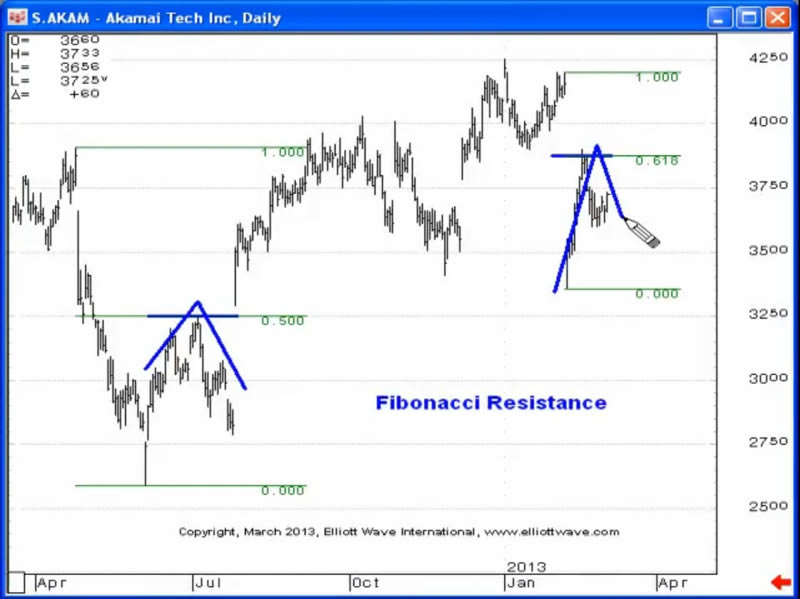
3) Fibonacci ratios also identify resistance and support. As Elliotticians, we often look at retracements, the most common being .382, .500 and .618. In Akamai Tech, Fibonacci support ignited the July and November 2012 rallies:

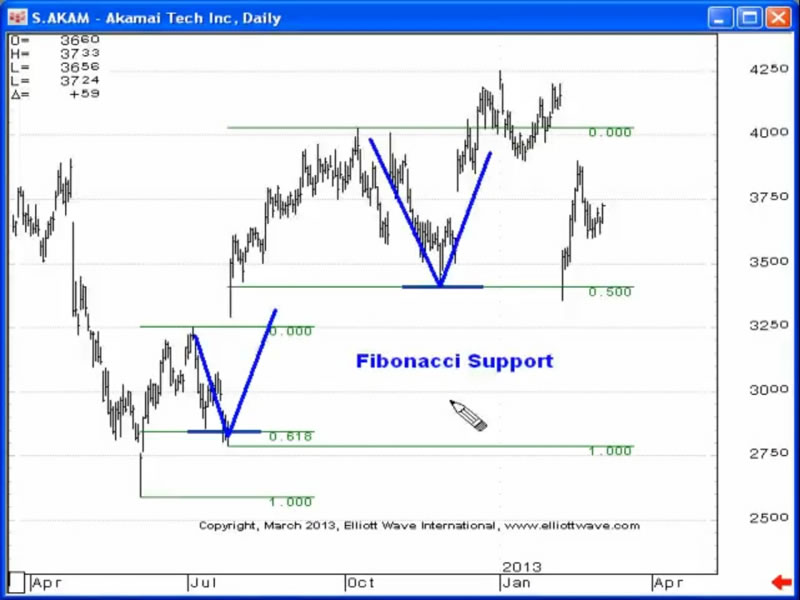
In the same chart you can also notice how Fibonacci resistance in AKAM halted the July 2012 and February advances.

For more free trading lessons on trendlines, download Jeffrey Kennedy's free 14-page eBook, Trading the Line -- 5 Ways You Can Use Trendlines to Improve Your Trading Decisions. It explains the power of simple trendlines, how to draw them, and how to determine when the trend has actually changed. Download your free eBook.


About the Publisher, Elliott Wave International
Founded in 1979 by Robert R. Prechter Jr., Elliott Wave International (EWI) is the world's largest market forecasting firm. Its staff of full-time analysts provides 24-hour-a-day market analysis to institutional and private investors around the world.


© 2005-2022 http://www.MarketOracle.co.uk - The Market Oracle is a FREE Daily Financial Markets Analysis & Forecasting online publication.


Post Comment

Only logged in users are allowed to post comments. Register/ Log in