


Exponential Explosions in Debt, the S&P, Crude Oil, Silver and Consumer Prices
Commodities / Gold and Silver 2015 Feb 03, 2015 - 03:05 PM GMTBy: DeviantInvestor

 In 1913 the US national debt was less than $3 Billion, gold was real money, and a cup of coffee cost a nickel.
By 2015 the US national debt had increased to over $18,000,000,000,000 ($18 Trillion), the gold standard was called a “barbarous relic,” most currencies had devolved into fiat paper and digital symbols backed by insolvent governments, and a Grande soy cinnamon latte, double pump, triple shot, extra hot, with sprinkles cost about five bucks.
Debt, money, coffee and prices have changed in 100 years.
What has NOT changed is the inevitable collapse of exponentially growing systems. A few extreme examples of exponential increases are:
- $0.01 (one penny) deposited at the 1st National Bank of Pontius Pilate at 6% interest in the year 15 would be worth approximately $4 Trillion Trillion Trillion Trillion dollars 2000 years later. (Yes, I double checked the numbers, and I used a web based compound interest calculator to triple check. Yes, the number has 48 zeros. Compound interest is the 8th wonder of the world.)
- Promise 1 grain of wheat on the 1st square of a chess board. Promise 2 grains of wheat on the 2nd Then 4 grains on the 3rd square and 8 grains on the 4th square and keep doubling. That promise will consume all the wheat grown in the world long before it gets to the 64th square. (Do you see the similarity between political promises and grains of wheat on chess squares?)
- The US national debt has increased at 9% per year since 1913 and slightly more rapidly since 2008. Assuming the 9% rate continues, the current $18 Trillion in national debt will grow to over $300 Trillion by the year 2065 and to about $6,000 Trillion by the year 2115.
I DOUBT IT!
Exponentially increasing systems cannot last forever. Our problem is that the global financial system is based on exponentially increasing debt, energy usage, population, and exploitation of natural resources. This appears to work nicely, especially for the financial and political elite, in the early years of the exponential increases. However, we are approaching the inevitable end of the exponential increases – perhaps not in a few months – but our systems probably will not last another decade. In the meantime, the plan seems to be “Party On!”
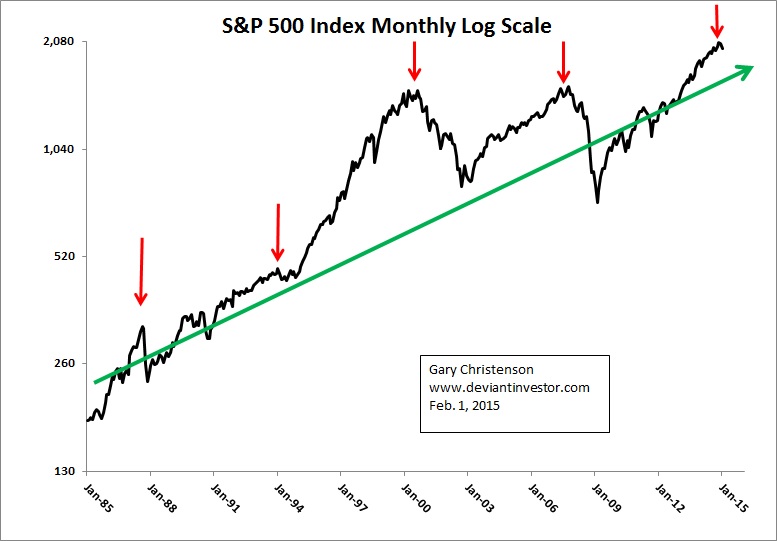
Examine the 30 year chart of the S&P 500 Index (monthly) on a log scale.
- Exponential increases are clearly visible.
- Peaks have occurred about every seven years.
- Rallies and crashes have become more extreme. Look out below!
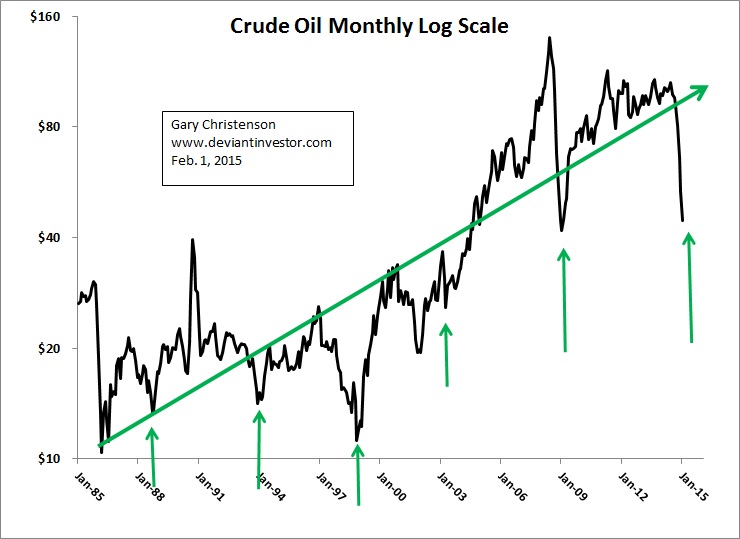
Examine the 30 year chart for crude oil on a log scale.
- Exponential increases are clearly visible.
- Lows have occurred every five to six years.
- Prices appear ready to rally – maybe not this month or even this year – but I don’t believe prices will stay this low for long when viewed from a 30 year perspective.
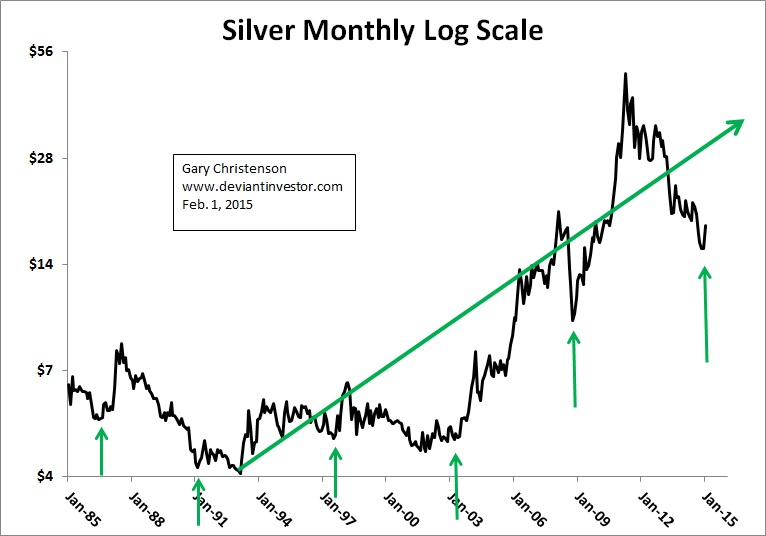
Examine the 30 year chart for silver on a log scale.
- Exponential increases are clear and very erratic.
- Important lows have been roughly six years apart.
- Prices look like they have fallen well below the exponential trend, are currently at a cyclic bottom, and have begun a rally. In my opinion, new highs are on the horizon.
CONCLUSIONS:
- Exponentially increasing systems do NOT last forever and become increasingly unstable.
- The current global financial system depends upon “printing” massive quantities of unbacked fiat currency and exponentially increasing debt.
- The exponentially increasing trends for debt, sovereign bonds, currencies, the S&P 500 Index, consumer prices, gold, crude oil, and silver are still in effect. But for how long? What happens at their critical phase transition points?
- The S&P looks like it could roll over at any time.
- Gold and silver appear ready to rally for several more years. Crude oil appears to be finding a bottom and will eventually rally.
- Unstable systems often react violently when they near a critical phase transition or crash point. When the global financial system reaches a phase transition or crash point, would you rather own fiat paper, such as sovereign bonds paying practically nothing and fiat currencies backed by the debt of insolvent entities, or silver and gold?
Repeat: Silver and gold have been a store of value for over 5,000 years. Unbacked paper fiat currencies have always failed. Do you trust politicians and central bankers more than you trust silver and gold? If not, I encourage you to take door # 2 – the one plated with silver on the top and gold on the bottom.
Gold is still undervalued, based on my long-term empirical model, by about 16%. Silver is also undervalued. Unless the President and the US congress slash expenses, actually reduce the national debt, negotiate world peace, and make many other unlikely policy changes, expect silver and gold to rally in a strong up-cycle for several, perhaps many, years.
GE Christenson aka Deviant Investor If you would like to be updated on new blog posts, please subscribe to my RSS Feed or e-mail
© 2015 Copyright Deviant Investor - All Rights Reserved Disclaimer: The above is a matter of opinion provided for general information purposes only and is not intended as investment advice. Information and analysis above are derived from sources and utilising methods believed to be reliable, but we cannot accept responsibility for any losses you may incur as a result of this analysis. Individuals should consult with their personal financial advisors.
© 2005-2022 http://www.MarketOracle.co.uk - The Market Oracle is a FREE Daily Financial Markets Analysis & Forecasting online publication.