


The Psychology of a Sideways Stock Market Trend
InvestorEducation / Trader Psychology Mar 05, 2015 - 03:36 AM GMTBy: Clif_Droke

 A fascinating study is the psychology that accompanies a prolonged sideways market trend. It also holds insights into what the future likely holds for stock prices.
When equities get stuck in a sideways trend for several months, investor psychology goes through four basic stages of change: 1.) initially they feel expectant that stock prices will quickly breakout of the newly formed range; 2.) when this fails to materialize sentiment turns sour as stocks drop to the lower boundary of the range; 3.) as stocks continue bouncing from the top to the bottom of the range investors begin to lose interest and eventually quit participating altogether with many selling their stock holdings. This is what forms the basis of a bullish accumulation pattern since “smart money” professional investors eagerly snap up the disgorged supply from disgruntled retail investors. 4.) Finally, as the range is nearing its final resolution, small investors who may, or may not, be invested are thoroughly frustrated at the lack of directional movement.
The frustration that has built up during the period of the lateral trend is released in various ways. Not uncommonly, trading range breakouts are preceded or accompanied by various expressions of mass frustration, including protests, civil unrest or conspicuous acts of violence. If the trading range continues long enough the subsequent release of pent-up tensions can even result in the initiation of military conflict. Witness the collective angst of Americans of all walks of life during the 1970s, a decade which was entirely encompassed by a lateral trading range in the stock market.
In my 20 years in the financial industry I’ve concluded that nothing exerts as profound an impact on mass psychology (to say nothing of investor psychology) than a prolonged sideways trend in equity prices. Why this should be is open for debate, but I have what I believe are valid insights. In highly developed capitalist nations such as the U.S. the stock market is the single biggest barometer for measuring the collective expectations for the business and economic outlook among all participants. The majority component of the U.S. economy is finance, directly or indirectly. Therefore everything concerning the material prosperity of the nation ultimately depends on the stock market.
It can also be observed that humans by nature are so conditioned to the concept of progress that anything which seems to undermine the longing for growth is viewed with contempt. A sideways trend in stock prices over a long period of months or years is rightfully seen as the antithesis of progress, hence the deep seated psychological frustration which underlies a trading range environment.
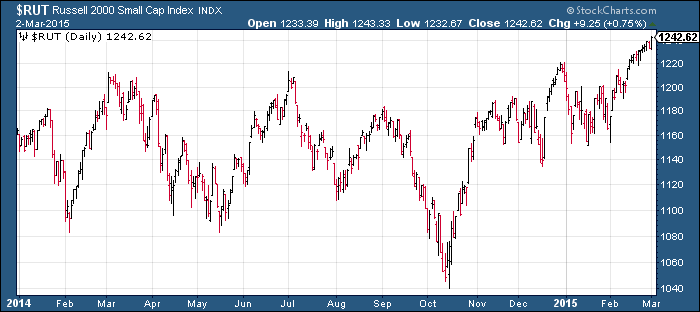
The recent breakout from the trading range in the U.S. stock market has witnessed a corresponding increase in militant threats in several regions of the globe. From last week’s failed cease-fire between Ukraine and Russia, to the fighting between Egypt and ISIS, to President Obama’s request for new war powers, the confluence in militarism has coincided with last week’s trading range breakout. The timing is no coincidence; indeed, it can be viewed as a natural reaction to a long and grueling period of no progress in the financial market.
Another aspect of trading range psychology is what I call “trading range trepidation.” I coined this term back in 2005 and have long observed its repeated influence of investors’ collective psyche. Trading range trepidation is a mental state which investors collectively feel when the major indices have spent many weeks or months in the lower portion of a range, then rally up to test the trading range ceiling. As the upper range is reached, investors become apprehensive. They’ve long been conditioned to seeing stocks rally to the former price highs, only to fall back and fail to pierce through the upper trading range boundary. Skepticism has been thoroughly established at this point and scarcely anyone believes that the market will break free from the confines of its upper limit.
When prices reach the upper band of the range, participation even among active traders tends to wane except among short sellers. Few traders are interested in buying along a trading range ceiling. Only when a decisive breakout is made above the ceiling do investors begin to show any interest.
“Breakout shock” is a term that describes the psychological state experienced by investors once the major indices finally push out from a long established trading range. Investors have become so numbed to the lack of action in the market that they’re simply unable to feel optimistic about a breakout from a trading range. It usually takes several weeks after the breakout before enthusiasm returns for equities.
In the final analysis, the trading range environment of the last several months has resulted in a depressed mood among small retail traders. While the more well-heeled individual investors which comprise much of the weekly AAII investor sentiment poll are more sanguine on the market outlook, the types of traders who collectively form what is known as the “trading public” are more sullen.
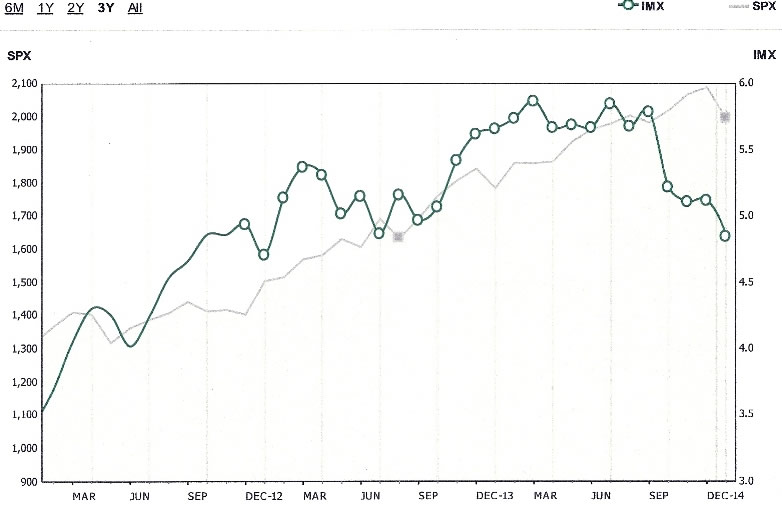
The following graph shows the Ameritrade Investor Movement Index, which tracks the amount of money retail traders are actually putting into the stock market. As the graph illustrates, interest in the market among Ameritrade’s clients has dwindled in recent months even as the SPX was making new highs.
As the current year progresses, I expect to see a gradual increase in participation among retail investors. The Year Five Phenomenon should provide a favorable tail-wind for equities and when small investors become convinced that stocks are emerging from the sideways trend, they’ll almost certainly be lured by the temptation to put more of their money to work where it gets the best treatment. And for the last few years that has been the U.S. stock market.
Mastering Moving Averages
The moving average is one of the most versatile of all trading tools and should be a part of every investor's arsenal. The moving average is one of the most versatile of all trading tools and should be a part of every investor's arsenal. Far more than a simple trend line, it's a dynamic momentum indicator as well as a means of identifying support and resistance across variable time frames. It can also be used in place of an overbought/oversold oscillator when used in relationship to the price of the stock or ETF you're trading in.
In my latest book, "Mastering Moving Averages," I remove the mystique behind stock and ETF trading and reveal a completely simple and reliable system that allows retail traders to profit from both up and down moves in the market. The trading techniques discussed in the book have been carefully calibrated to match today's fast-moving and sometimes volatile market environment. If you're interested in moving average trading techniques, you'll want to read this book.
Order today and receive an autographed copy along with a copy of the book, "The Best Strategies For Momentum Traders." Your order also includes a FREE 1-month trial subscription to the Momentum Strategies Report newsletter: http://www.clifdroke.com/books/masteringma.html
By Clif Droke
www.clifdroke.com
Clif Droke is the editor of the daily Gold & Silver Stock Report. Published daily since 2002, the report provides forecasts and analysis of the leading gold, silver, uranium and energy stocks from a short-term technical standpoint. He is also the author of numerous books, including 'How to Read Chart Patterns for Greater Profits.' For more information visit www.clifdroke.com
Clif Droke Archive |
© 2005-2022 http://www.MarketOracle.co.uk - The Market Oracle is a FREE Daily Financial Markets Analysis & Forecasting online publication.