


U.S. Employment Trends - What Age Groups Get the Jobs?
Economics / Employment Mar 07, 2015 - 05:32 PM GMTBy: Mike_Shedlock

 One interesting fact in today's jobs report (see Diving Into the Payroll Report: Establishment +295K Jobs; Household +96K Employment, Labor Force -178K) was a drop in teenage unemployment of 1.7 percentage points while overall the unemployment rate fell by only 0.2 percentage points.
The only reason the overall rate fell was a plunge in labor force of 178,000. Household survey employment only rose by 96,000 vs. the establishment survey gain of an alleged +295,000.
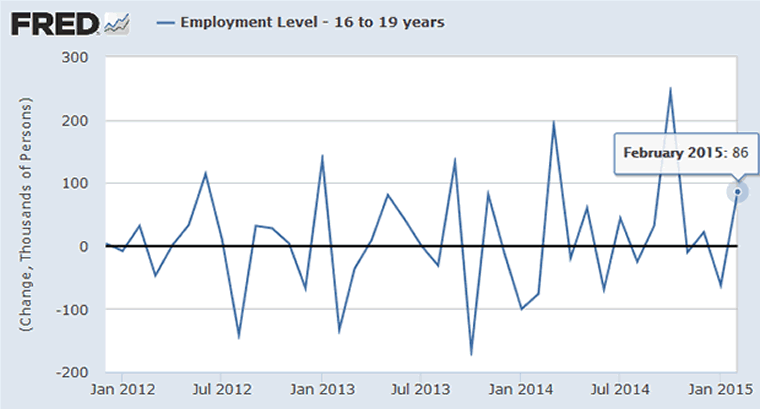
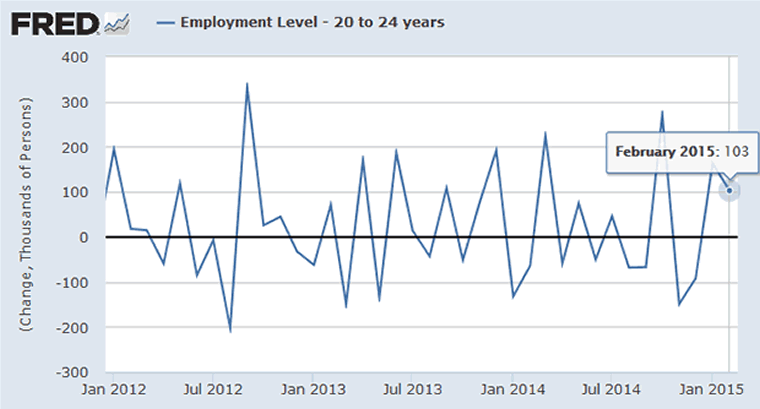
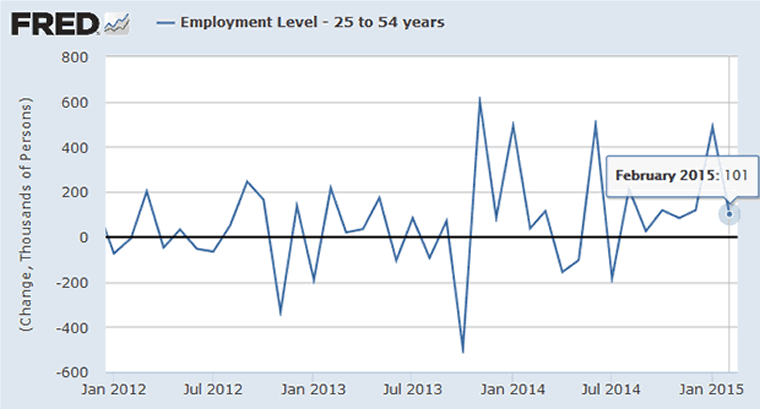
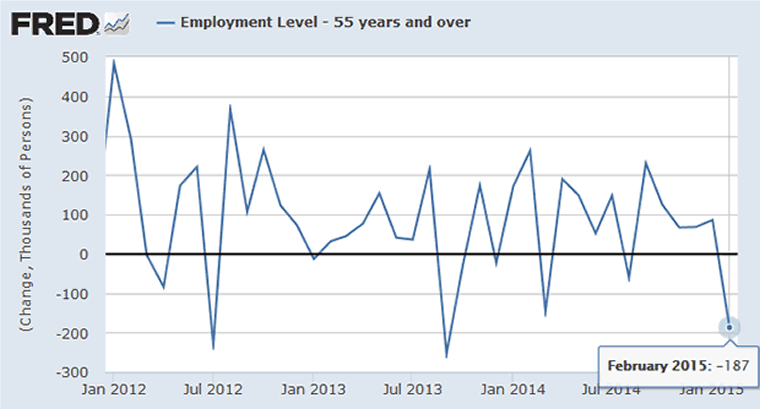
The decline in teenage unemployment got me wondering: Where are the jobs, and what age groups got them? Here are a few seasonally adjusted charts from the St. Louis Fed.
Employment 16-19 Month Over Month
Employment 20-24 Month Over Month
Employment 25-54 Month Over Month
Employment 55+ Month Over Month
Age Categories
25-54 is a rather broad category. So is 55+. I would have liked to see finer breakdowns.
Additional data is available on the BLS data site directly, but even there, not all of the seasonally adjusted numbers I wanted were available. However, all of the age groups I wanted to see on a "not seasonally adjusted" basis were available.
Let's take a look at the two sets of tables I created from BLS data.
Not Seasonally Adjusted Employment Growth Year-Over-Year
| Age Group |
Employment Growth Y/Y NSA |
Population Growth Y/Y |
Employment Relative to Population Growth |
| 16-19 | 456,000 | -34,000 | 490,000 |
| 20-24 | 409,000 | -26,000 | 435,000 |
| 25-34 | 866,000 | 617,000 | 249,000 |
| 35-44 | 69,000 | 108,000 | -39,000 |
| 45-54 | 464,000 | -207,000 | 671,000 |
| 55-59 | 175,000 | 279,000 | -104,000 |
| 60-64 | 296,000 | 543,000 | -247,000 |
| 65+ | 228,000 | 1,534,000 | -1,306,000 |
Note the huge outsized job gains in age groups 16-19 and 20-24. On an age-adjusted basis, the job gains are even greater.
Also the demographic shift to age group 25-34 puts the 866,000 job gain in that group in proper perspective. Relative to population growth, age group 35-44 actually lost jobs.
Retirement explains age groups 60-64 and 65+. Retirement (and forced retirement), along with rising disability fraud, also explains the drop in participation rate.
By forced retirement I mean people who want a job but do not have one, so they retire to collect Social Security because they need the income.
Seasonally Adjusted Employment Growth Month-Over-Month
| Age Group |
Employment Growth M/M SA |
Population Growth M/M |
| 16-19 | 86,000 | -6,000 |
| 20-24 | 103,000 | -20,000 |
| 25-34 | 108,000 | 37,000 |
| 35-44 | -86,000 | 2,000 |
| 45-54 | 78,000 | -55,000 |
| 55+ | -187,000 | -6,000 |
Perspective on the 96K Household Survey Gain
Of the 96,000 gain in employment this month, 189,000 of it came in the age group 16-24 even though that population group dropped by 26,000!
Please stop and think about that for a second.
Yes, retirement affected the overall results, but even so, age group 35-44 lost 86,000 jobs. Overall it seems reasonably safe to assume more high-paying jobs were lost this month than gained.
Still think this was a good jobs report?
Close scrutiny of both month-over-month and year-over-year data suggests we keep adding low wage jobs while boomers retire en masse.
These job reports are nowhere near as strong as most think.
By Mike "Mish" Shedlock
http://globaleconomicanalysis.blogspot.com
Click Here To Scroll Thru My Recent Post List
Mike Shedlock / Mish is a registered investment advisor representative for SitkaPacific Capital Management . Sitka Pacific is an asset management firm whose goal is strong performance and low volatility, regardless of market direction.
Visit Sitka Pacific's Account Management Page to learn more about wealth management and capital preservation strategies of Sitka Pacific.
I do weekly podcasts every Thursday on HoweStreet and a brief 7 minute segment on Saturday on CKNW AM 980 in Vancouver.
When not writing about stocks or the economy I spends a great deal of time on photography and in the garden. I have over 80 magazine and book cover credits. Some of my Wisconsin and gardening images can be seen at MichaelShedlock.com .
© 2014 Mike Shedlock, All Rights Reserved.
Disclaimer: The above is a matter of opinion provided for general information purposes only and is not intended as investment advice. Information and analysis above are derived from sources and utilising methods believed to be reliable, but we cannot accept responsibility for any losses you may incur as a result of this analysis. Individuals should consult with their personal financial advisors.
Mike Shedlock Archive |
© 2005-2022 http://www.MarketOracle.co.uk - The Market Oracle is a FREE Daily Financial Markets Analysis & Forecasting online publication.