


Renminbi The Market is Simply NOT Expecting This to Happen
Currencies / China Currency Yuan Mar 18, 2015 - 02:59 PM GMTBy: Submissions

 Miha Zupan writes: To succeed in investing you essentially have to beat the majority of other investors. This will not be achieved by thinking like everyone else. You will have to think and act differently to everyone else.
How do most people think when it comes to trading, or at least what do they spend most of their time on? The majority spend their time attempting to determine what will happen in the future? Very few think about risk and reward. That is, how much will I make if I am right versus how much will I lose if I am wrong! Yes, to succeed you must think more about payoffs of future events not the future itself.
It is this simple concept which separates great traders from merely good traders. We will come back to this concept later.
Today I want to talk about China, yet again. But this time I want to talk about the ultimate effect of the Chinese central bank’s obsession with managing its exchange rate.
As you are probably aware China manages its exchange rate by letting it trade within a band. They do this for a simple reason – to suppress currency volatility and uncertainty that comes with volatility. However, what few realize is that the act of trying to suppress volatility actually increases it – eventually. Chris recently wrote an article on how all currency pegs break. The more one tangles with market forces the greater the consequences of this action in the future. Some fantastic examples of how the asymmetry builds up can be found in our article on the topic.
When you have been involved in the markets for many years you will probably come to realize a pattern in market behaviour. Periods of low volatility are followed by periods of high volatility. This observations tie in nicely with Nassim Taleb’s concept of fragility and anti-fragility: systems that appear stable and have not been subject to stress are inherently fragile. The more stress a system has been subject to the more anti-fragile it becomes.
The recent action in the Swiss franc is a perfect illustration of this concept. The EUR/CHF was, effectively, frozen in time for the better part of 3 years with the Swiss National Bank (SNB) stepping in to prevent the EUR/CHF from falling below 1.20.
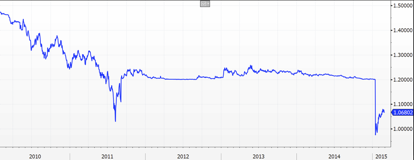
EUR/CHF spot rate chart
By pegging the CHF to the euro at 1.20 the SNB put a lid on how much it would appreciate against the euro. In doing so the SNB’s balance sheet grew faster than even the US Federal Reserve’s balance sheet, and finally in January the SNB realized it was fighting a losing battle and threw the towel in. This resulted in an “off the Richter scale” move (+30%) in a few minutes! This disorderly revaluation shook the currency markets and impaired a number of financial institutions!
In trying to suppress volatility and create more certainty all the SNB euro pegging efforts succeeded in doing was to achieve the exact opposite!
Going back to China and its managed exchange rate – doesn’t the suppression of volatility ultimately create more fragility in the Renminbi? Yes, it may appear to be very stable now with relatively little volatility but in a couple of years from now this could well be a very different story!
Now, to better understand the long term outlook for the Chinese renminbi let’s first understand how currencies have fared against the USD since it bottomed out in 2011.
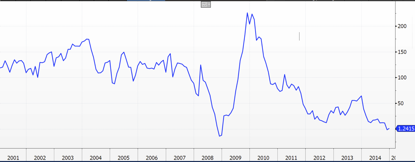
Below is the JP Morgan Emerging Markets Currency Index. This is a tradeable benchmark for emerging markets currency markets. It is comprised of 10 liquid currencies across three geographic regions, all equally weighted: Latin America (CLP, BRL, MXN), Central and Eastern Europe, Middle East and Africa (HUF, ZAR, RUB, TRY), and Asia (SGD, CNY, INR). It has fallen by some 30% which means that the USD has appreciated by some 30% against these currencies.
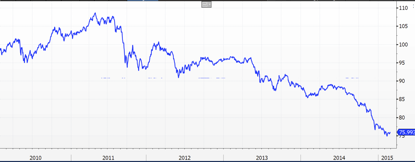
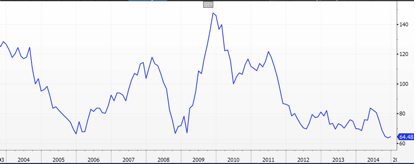
Similarly, the USD Index (below) which tracks the performance of the USD against developed market currencies has risen by some 27% since the bottom in 2011.
During this time the renminbi has appreciated by about 4%.
So what, you might say? Well, in essence Chinese exporters have become less and less competitive over the last 4 years. Given how quickly the Chinese economy is slowing (due in no small part to them losing export competitiveness). If the USD continues to appreciate Chinese exporters will continue to lose competitiveness.
Below is an index of implied volatility of long-term options on the USD/renminbi. Although volatility has increased somewhat over the last 6 months it remains very low and, by comparison, it is only a third of volatility on the Aussie dollar and euro.
Clearly the crowd still doesn’t believe that a material movement in the renminbi is on the horizon. This is a dramatic mispricing and it is where opportunity knocks! I believe this trade can potentially have a much bigger payoff than the U.S subprime mortgage collapse and European crisis did.
I see no way that the Chinese can avoid a material devaluation of their currency or face an economic recession. Or perhaps both.
When we look around the world today, virtually every central bank is engaged in aggressive monetary debasement, bringing their currencies down in value against the USD to make things look better than they are. While this may ultimately have inflationary consequences, in the meantime central bankers see absolutely no negative consequences in monetary debasement/quantitative easing – call it what you will. So they will continue doing what they are doing which will push their currencies lower and leave Chinese exporters “high and dry”, unless the renminbi is allowed to materially devalue!
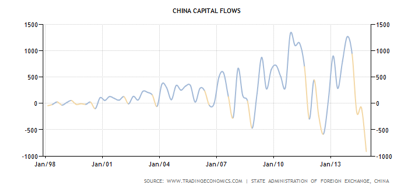
China’s primary monetary policy tool has been to actively manage its USD/CNY exchange rate. In 2014, the game changed in China as the super easy monetary policy from the US Fed came to an end. No more QE and slowing global growth created an environment where all these foreign exchange (FX) inflows not only dried up but turned into outflows (capital flight).
As a result, China’s economy is exposed to a risk it has not had to think about since 1994 – credit contraction! The Chinese authorities are aware of this and the PBOC has taken measures to ease monetary policy. They have injected liquidity into the banking system and cut rates twice in the last 6 months. So the monetary policies of the PBOC and the Fed have begun to meaningfully diverge for the first time in many years. Without another round of QE from the Fed, this divergence is almost certain to accelerate and create enormous problems for China and their currency peg.
This divergence is very important because similar divergences have been the catalysts behind the dramatic weakening of the Japanese yen and the euro against the USD over the last few years.
The Chinese have reached a crossroad, but they are in denial. Despite the rosy picture painted by official statistics, such as GDP growth, more reliable indicators of economic activity tell a much different story.
Bank of America Merrill Lynch China Leading Economic Activity Pulse Index is an index of the year-over-year changes of seven component indicators (power output, steel output, cement output, auto sales, housing starts, railway cargo turnover, and medium to long term loans).
BofA Merrill Lynch China Leading Economic Activity Pulse Index
If this index is anything to go by the 7% GDP growth that the Chinese authorities tout is a mere figment of their imagination!
China Monetary Conditions Index (below) is based on real exchange rates and total loan growth. It seems to me that monetary conditions are as tight as what they were during the height of the GFC when the world’s financial system froze up!
China Monetary Conditions Index
The two graphs above suggest that the Chinese economy is in very big trouble! To prevent a collapse of China’s financial system, crippling economic contraction and a destabilizing rise in unemployment, the PBOC must take more aggressive action.
Clearly the efforts of the Chinese authorities to “stimulate” their economy are not working and will not work. The historical means for providing monetary stimulus is unavailable, as net foreign exchange inflows no longer exist.
In light of this the Chinese seem to have changed the focus of their monetary policy from one that targets the exchange rate to one that targets domestic money supply growth. This shift will only serve to increase the divergence between the Fed and PBOC monetary policies and put more downward pressure on the renminbi.
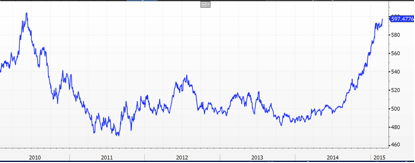
Recent behaviour in the renminbi would suggest that the Chinese authorities are gradually losing control of the exchange rate. Technically, with a higher high and higher low, it would appear that the USD/CNY is getting ready for a material move to the upside.
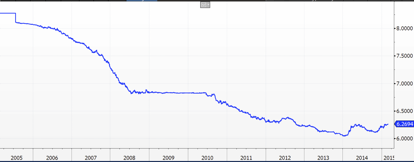
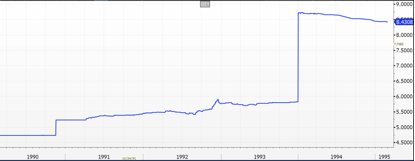
USD/CNY spot rate chart
How high can the USD/CNY go? As discussed above, the USD has appreciated by about 30% against an equally weighted basket of currencies since 2011 with most of this move occurring during the last 6 months. However, the renminbi has appreciated by some 4% against the USD during this time. If the CNY were to only recover the amount it appreciated against other currencies since 2011 then the USD/CNY would be approximately 8.40 today (6.27 today multiplied by 1.34). That is a big move, which isn’t even remotely being priced in by the market.
Does a move of this magnitude sound far fetched? Well, if you were around long enough you might remember a similar move that occurred in one day, late December 1993 (as shown on the USD/CNY spot rate chart below)!
Let’s not forget the Asian financial crisis in 1997 when capital flight took hold Asian currencies didn’t just depreciate by 30% – it was multiples of that!
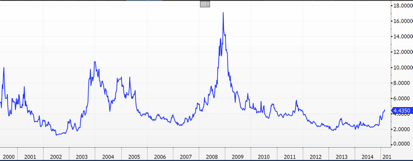
Note the rupiah graph below. Prior to the Asian financial crisis, the rupiah and many other Asian currencies were managed or pegged to the USD in an attempt to reduce volatility and make the future less uncertain for exporters/importers. As it turned, out all this served to do was to cause more volatility in an exponential way!
Financial systems that appear robust are more often than not inherently fragile!
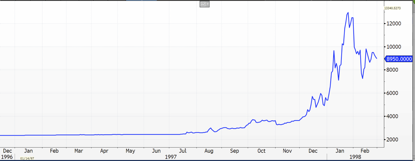
USD/Indonesian rupiah spot price chart
One message from the Asian crisis is very clear: be weary of any central authority who tries to suppress currency volatility! The more a central bank tries to suppress currency volatility the greater the consequences down the track. And contrary to popular belief China is no exception!
Perhaps the payoff to buying long term calls in the USD/renminbi could well rival the returns that occurred to those wise few that had the wisdom to “short” sub-prime back in 2007/2008. Given the risk/reward payoff I think the trade is way too attractive to pass by.
- Brad
“Fragility is the quality of things that are vulnerable to volatility.” – Nassim Nicholas Taleb
Capitalist Exploits is a team of globe-trotting professionals dedicated to seeking out and investing into unique, undiscovered, and profitable opportunities worldwide. This could be an asymmetric trading opportunity in the global currency markets, seeding a tech startup in Israel, or co-investing into a bespoke private equity deal in Ghana! Our team lives and spends time in several different countries, on several different continents. Although we all come from different cultural backgrounds and parts of this great ball of dirt hurtling through space, in today’s world this matters little, as our values and mission are all aligned.
Copyright © 2015 Miha Zupan- All Rights Reserved Disclaimer: The above is a matter of opinion provided for general information purposes only and is not intended as investment advice. Information and analysis above are derived from sources and utilising methods believed to be reliable, but we cannot accept responsibility for any losses you may incur as a result of this analysis. Individuals should consult with their personal financial advisors.
© 2005-2022 http://www.MarketOracle.co.uk - The Market Oracle is a FREE Daily Financial Markets Analysis & Forecasting online publication.