


Gold Price Downside $850/oz; Upside Jump to $2,000/oz on ‘Grexit’
Commodities / Gold and Silver 2015 Mar 20, 2015 - 02:29 PM GMTBy: GoldCore

 Capital Economics chart-based analysis sees gold ending year higher at $1,400 per ounce
-Sees a remote possibility of gold falling to $850 per ounce
-A “Grexit” may cause gold to surge to $2,000 per ounce
Julian Jessop from Capital Economics has written an interesting short piece on the company’s expectation for gold prices. It analyses golds performance, in four charts, against the US dollar, US treasury yields and expectations by investors for a Eurozone break-up.
Capital Economics
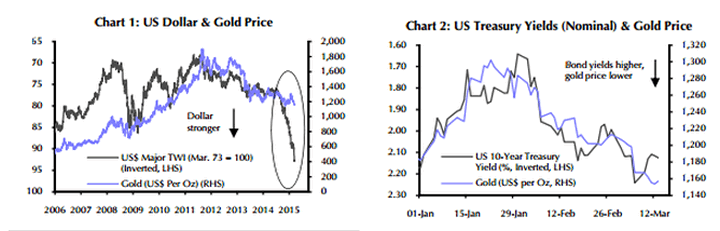
The first chart shows the inverse relationship between gold and the US dollar trade weighted index. As the dollar began its decline in mid-2010 it had a very close inverted relationship with gold.
In July 2011, the dollar began to strengthen again and gold began to decline almost moving in lock-step. When the spike which pushed the dollar to its current bloated valuations began in July of last year gold began its steep decline – in dollar terms.
However, Capital Economics chart shows that this inverted relationship between gold and the dollar broke down in November. The dollar soared from July to the present, spiking 21% against the other major currencies.
Had the relationship continued gold would probably be trading at somewhere between $400 and $800 dollars per ounce. Instead it fell to around the $1,150 mark and has been hovering in that region since.
Capital Economics make the point that the most of the negative commentary regarding gold in recent months misses “the rather bigger point that the gold price has held up remarkably well given the extent of dollar’s move.”
We would add that it is the U.S. dollar which looks precariously out of synch with historical norms and that gold looks relatively comfortable in its current range.
The analysis moves on to the relationship between gold and treasury yields which has also been close this year. Capital Economics speculates that “a 50bp rise in 10-year Treasury yields would appear to be consistent with a $150 fall in the price of an ounce of gold.

Capital Economics
They speculate that a 100bp rise in yields this year could therefore push gold down to $850 an ounce. The third chart shows a close relationship between gold and real yields since 2008 which suggests, however, that gold has already fallen disproportionately against yields.
They add that these charts do not consider the fact that miners simply cannot produce gold at such a low price and that buyers in Asia consistently buy dips in price in large volumes.
They also reference geo-political factors – specifically the possibility of a “Grexit”- which is the subject of their final chart.
Chart 4 graphs the gold price against “Investor Expectations of Euro Break-Up”. The data was collated by Senix in Frankfurt.
In mid-2012 investors polled by Senix assigned a probability of over 70% to a Euro break-up. This corresponded with gold surging to its record nominal highs.By around October of last year investors gave a Euro break-up a probability of around 10% as gold was falling through the $1,200 per ounce region.
By this metric it would appear that an 80% expectation of a “Grexit” could push gold up towards the $2,000 mark. However, by mid-January, that negative expectation had risen to over 35% with no discernible corresponding rise in gold prices.
Must Read Guide: Gold is a Safe Haven Asset
MARKET UPDATE
Today’s AM fix was USD 1,171.75, EUR 1,096.17 and GBP 794.73 per ounce.
Yesterday’s AM fix was USD 1,164.00, EUR 1,091.52 and GBP 781.10 per ounce.
Gold fell 0.06 percent or $0.70 and closed at $1,170.30 an ounce yesterday, while silver rose 0.44 percent or $0.07 at $16.13 an ounce.
In Singapore, bullion for immediate delivery hovered at at $1,171.20 an ounce near the end of day trading, close to its two week high of $1,177.46 reached yesterday.
The yellow metal is up nearly a percent this week its largest weekly gain since January, after reaching a four month low just prior to the U.S. FOMC policy meeting outcome.
The Fed’s dovish stance on interest rates, caution over the U.S. economic recovery, Yellen’s fear about the dollar’s strength, coupled with a Fed that decreased the Fed Fund rate estimates – all were bullish for precious metals.
The world’s largest ETF, The SPDR Gold Trust, logged its first inflows in a month.
Physical demand from Chinese buyers is seeing Shanghai Gold Premiums at $6-$7 above the benchmark.
Goldman Sachs has joined HSBC, Societe Generale, UBS, Barclays and Scotiabank in the ICE Benchmark Administration Limited (IBA).
The IBA has replaced the almost 100 year old London Gold Fix today and the above banks will set prices electronically.
In London’s late morning trading, spot gold is at $1,173.28 or up 0.12 percent. Silver is $16.20 or up 0.30 percent and platinum is $1,125.39 or up 0.22 percent.
Platinum is trading at almost a $50 discount to gold and The Perth Mint of Australia said it is increasing its production of platinum coins to meet the strong demand.
This update can be found on the GoldCore blog here.
Mark O'Byrne
Director
IRL |
UK |
IRL +353 (0)1 632 5010 |
WINNERS MoneyMate and Investor Magazine Financial Analysts 2006
Disclaimer: The information in this document has been obtained from sources, which we believe to be reliable. We cannot guarantee its accuracy or completeness. It does not constitute a solicitation for the purchase or sale of any investment. Any person acting on the information contained in this document does so at their own risk. Recommendations in this document may not be suitable for all investors. Individual circumstances should be considered before a decision to invest is taken. Investors should note the following: Past experience is not necessarily a guide to future performance. The value of investments may fall or rise against investors' interests. Income levels from investments may fluctuate. Changes in exchange rates may have an adverse effect on the value of, or income from, investments denominated in foreign currencies. GoldCore Limited, trading as GoldCore is a Multi-Agency Intermediary regulated by the Irish Financial Regulator.
GoldCore is committed to complying with the requirements of the Data Protection Act. This means that in the provision of our services, appropriate personal information is processed and kept securely. It also means that we will never sell your details to a third party. The information you provide will remain confidential and may be used for the provision of related services. Such information may be disclosed in confidence to agents or service providers, regulatory bodies and group companies. You have the right to ask for a copy of certain information held by us in our records in return for payment of a small fee. You also have the right to require us to correct any inaccuracies in your information. The details you are being asked to supply may be used to provide you with information about other products and services either from GoldCore or other group companies or to provide services which any member of the group has arranged for you with a third party. If you do not wish to receive such contact, please write to the Marketing Manager GoldCore, 63 Fitzwilliam Square, Dublin 2 marking the envelope 'data protection'
GoldCore Archive |
© 2005-2022 http://www.MarketOracle.co.uk - The Market Oracle is a FREE Daily Financial Markets Analysis & Forecasting online publication.