


How Easy Money Drives the Stock Market
Stock-Markets / Economic Theory Apr 09, 2015 - 02:02 PM GMTBy: Frank_Shostak

 In a market economy a major service that money provides is that of the medium of exchange. Producers exchange their goods for money and then exchange money for other goods.
As production of goods and services increase this results in a greater demand for the services of the medium of exchange (the service that money provides).
Conversely, as economic activity slows down, the demand for the services of money follows suit.
Prices and the Demand for Money
The demand for the services of the medium of exchange is also affected by changes in prices. An increase in the prices of goods and services leads to an increase in the demand for the medium of exchange.
People now demand more money to facilitate more expensive goods and services. A fall in the prices of goods and services results in a decline in the demand for the medium of exchange.
Now, take the example where an increase in the supply of money for a given state of economic activity (i.e., production) has taken place. Since there wasn’t any change in the demand for the services of the medium of exchange, this means that people now have a surplus of money or an increase in monetary liquidity.
No individual wants to hold more money than is required, and an individual can get rid of surplus cash by exchanging the money for goods.
All the individuals as a group, however, cannot get rid of the surplus of money just like that. They can only shift money from one individual to another individual.
The mechanism that generates the elimination of the surplus of cash is the increase in the prices of goods. Once individuals start to employ the surplus cash in acquiring goods, it pushes prices higher.
As a result the demand for the services of money increases. All this in turn works toward the elimination of the monetary surplus.
Note that what has triggered increases in the prices of goods in various markets is the increase in the monetary surplus or monetary liquidity in response to the increase in the money supply.
Price Deflation and the Money Supply
While increases in the money supply result in a monetary surplus, a fall in the money supply for a given level of economic activity leads to a monetary deficit.
Individuals still demand the same amount of services from the medium of exchange. To accommodate this they will start selling goods, thus pushing their prices down.
At lower prices the demand for the services of the medium of exchange declines and this in turn works toward the elimination of the monetary deficit.
A change in liquidity, or the monetary surplus, can also take place in response to changes in economic activity and changes in prices.
For instance, an increase in liquidity can emerge for a given stock of money and a decline in economic activity.
A fall in economic activity means that fewer goods are now produced. This means that fewer goods are going to be exchanged, implying a decline in the demand for the services of money.
Once, however, a surplus of money emerges, it produces exactly the same outcome with respect to the prices of goods and services as the increase in the money supply does. That is, it pushes prices higher.
An increase in prices in turn works toward the elimination of the surplus of money — the elimination of monetary liquidity.
Conversely an increase in economic activity while the stock of money stays unchanged produces a monetary deficit.
This in turn sets in motion the selling of goods thereby depressing their prices. The fall in prices in turn works toward the elimination of the monetary deficit.
These dynamics can affect a wide variety of markets unequally, but one market in which we can see the relationship between prices and money supply is the stock market.
A Time Lag Between Peak Liquidity and Peak Stocks?
There is a time lag between changes in liquidity, i.e., a monetary surplus, and changes in asset prices such as the prices of stocks.
(The reason for the lag is because when money is injected it doesn’t affect all individuals and hence all markets instantly. There are earlier and later recipients of money.)
For instance, there could be a long time lag between the peak in liquidity and the peak in the stock market.
The effect of previously rising liquidity can continue to overshadow the effect of currently falling liquidity for some period of time. Hence the peak in the stock market emerges once declining liquidity starts to dominate the scene.
Historical Examples: 1927 to 2009
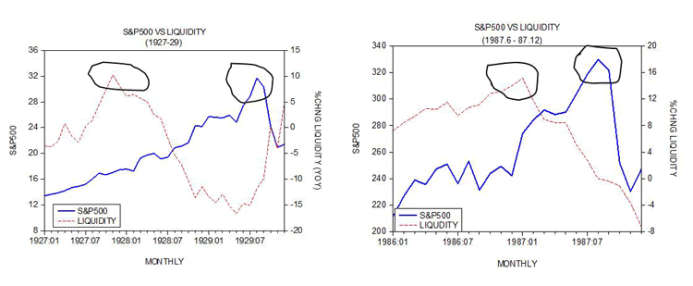
For instance, the yearly rate of growth of liquidity topped in November 1927 at 10.2 percent — after a time lag of 22 months the S&P 500 responded by peaking in August 1929 at 31.71. (Note liquidity is the yearly percent changes in AMS minus yearly percent changes in the CPI and industrial production.) In 1987 the time lag between a peak in liquidity and a peak in the stock market was much shorter — the yearly rate of growth of liquidity topped in January 1987 at 15.1 percent. The S&P 500 responded to this by peaking eight months later at 329.9 in September of that year.
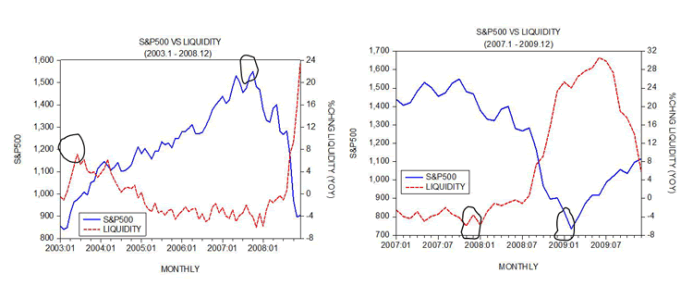
According to historical data the yearly rate of growth of liquidity bottomed at minus 16.6 percent in May 1929. Yet it took a long time before the S&P 500 responded to this. It took over three years after the bottom in liquidity was reached before the S&P 500 started to recover. The stock price index bottomed in June 1932 at 4.43. The time lag between the bottom in liquidity and the bottom in the stock market has been shorter in more recent history. Thus the yearly rate of growth of liquidity had bottomed at minus 5.7 percent in September 2000. It took twenty-five months before the S&P 500 bottomed at 815.28 in September 2002.

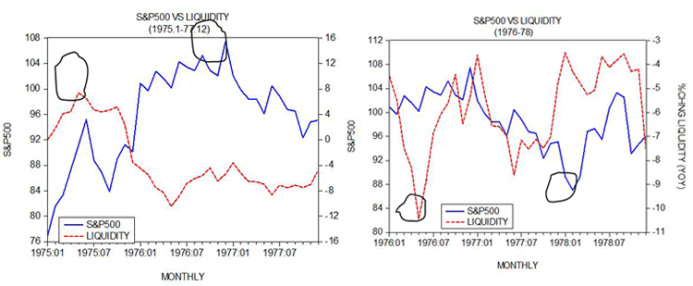
Another example is the yearly rate of growth of our monetary measure AMS which stood at 4.5 percent in May 1975. The yearly rate of growth of the consumer price index stood at 9.5 percent while the yearly rate of growth of industrial production closed at minus 12.4 percent. As a result, our measure of liquidity reached a high of 7.4 percent. In response to this the S&P 500 peaked at 107.5 in December 1976. Now, our measure of liquidity hit bottom at minus 10.4 percent in May 1976. The S&P 500 reached its bottom at 87.04 in February 1978 — a fall of 19 percent from the peak.
The S&P 500 closed at 1,549.30 in October 2007 before a large decline took place bringing the stock index to 735.1 by February 2009 — a fall of 52.3 percent. The yearly rate of growth of liquidity peaked at 7.1 percent in June 2003 (see chart). Note that the bottom in the stock price index at 735.1 reached in February 2009 was preceded by a bottom in liquidity at minus 6 percent in November 2007.
Where Are We Now?
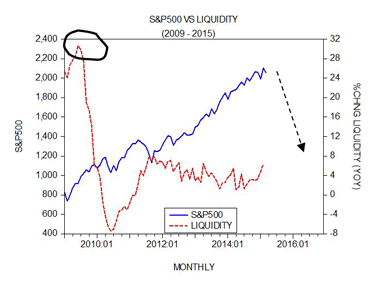
We suggest that a major threat to the S&P 500 is a fall in liquidity from 30.6 percent in June 2009 to minus 7.4 percent by June 2010. (Note again that the time lag between a peak in liquidity and a peak in the S&P 500 is variable.)
Now if we were to assume a time lag of around six years, then we can suggest that based on the peak in liquidity in June 2009 the level of the S&P 500 of 2,061 reached so far in March this year could be not far from the top.
Frank Shostak is an adjunct scholar of the Mises Institute and a frequent contributor to Mises.org. He is chief economist of M.F. Global. Send him mail. See Frank Shostak's article archives. Comment on the blog.![]()
© 2015 Copyright Frank Shostak - All Rights Reserved Disclaimer: The above is a matter of opinion provided for general information purposes only and is not intended as investment advice. Information and analysis above are derived from sources and utilising methods believed to be reliable, but we cannot accept responsibility for any losses you may incur as a result of this analysis. Individuals should consult with their personal financial advisors.
© 2005-2022 http://www.MarketOracle.co.uk - The Market Oracle is a FREE Daily Financial Markets Analysis & Forecasting online publication.