


Do We Now Have a Stocks Bull or Bear Market?
Stock-Markets / Stock Markets 2015 Apr 14, 2015 - 10:33 AM GMTBy: Marty_Chenard

If you have gone to StockTiming.net (.net) in the past, you have seen the formula for creating a Monthly, long term Bull/Bear market chart.
This morning, I would like to post the chart and make a few comments.
The chart is below and under a lot of stress. There is a Federal Reserve impact going on because of the Inflowing Liquidity levels.
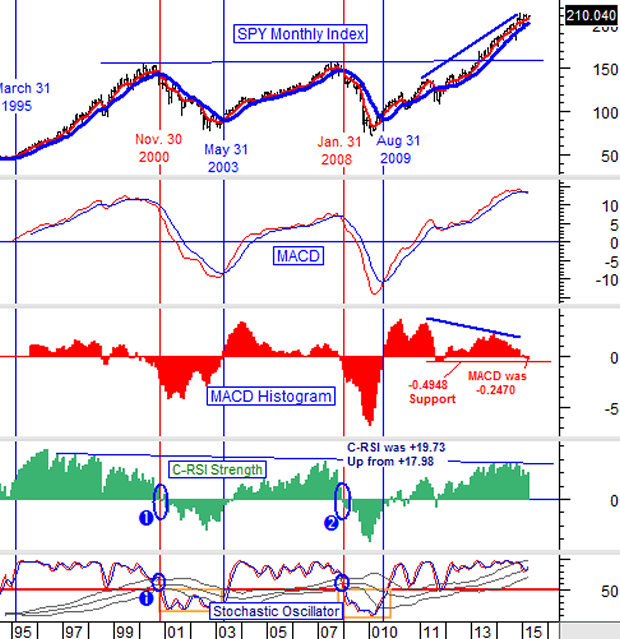
Note what is going on with the chart:
- the monthly SPY trend lines are still trending higher.
- the MACD is showing a downside cross-over.
- the MACD is negative and slightly above a support level.
- the C-RSI strength is a strong positive.
- the Stochastic Oscillator is at the Bollinger mid-line with an up tick.
What does this all add up to?
It says that today's market is a mixed, Up condition under a lot of stress.
The Fed will continue to dominate the market's direction until Institutional Investors sell "as a group". When such a time does arrive, the Fed will not be able to match the outflow of funds. So, at this point, hedging any long positions is a prudent idea.
By Marty Chenard
http://www.stocktiming.com/
Please Note: We do not issue Buy or Sell timing recommendations on these Free daily update pages . I hope you understand, that in fairness, our Buy/Sell recommendations and advanced market Models are only available to our paid subscribers on a password required basis. Membership information
Marty Chenard is the Author and Teacher of two Seminar Courses on "Advanced Technical Analysis Investing", Mr. Chenard has been investing for over 30 years. In 2001 when the NASDAQ dropped 24.5%, his personal investment performance for the year was a gain of 57.428%. He is an Advanced Stock Market Technical Analyst that has developed his own proprietary analytical tools. As a result, he was out of the market two weeks before the 1987 Crash in the most recent Bear Market he faxed his Members in March 2000 telling them all to SELL. He is an advanced technical analyst and not an investment advisor, nor a securities broker.
Marty Chenard Archive |
© 2005-2022 http://www.MarketOracle.co.uk - The Market Oracle is a FREE Daily Financial Markets Analysis & Forecasting online publication.