Why 2 of U.S. Dollar's Recent Bottoms Have 1 Thing In Common
Currencies / US Dollar Apr 24, 2015 - 04:37 PM GMTBy: EWI
 In 2009 and 2014, a simple chart pattern enabled us to turn bullish the dollar, just in time for HUGE rallies. Learn to use this pattern now.
Imagine you're on an airplane, mid-air, when the intercom from the cockpit accidentally turns on. You and the entire cabin crew overhear the pilot say this to his copilot:
"I know we're heading northeast at 430 mph. But... I have no idea when or where I'm supposed to land."
That's when you cough up your bag of peanuts!
Dramatic? Sure. Imaginary? Yes. But it also highlights the real limits of mainstream financial analysis, which has no trouble identifying the current trend in a financial market -- but has little idea as to when or where that trend will end.
This is where the Wave Principle really can help you. Elliott wave analysis recognizes about a dozen distinct price patterns in financial markets. Each pattern conforms to clear, objective rules and guidelines that help you -- the investor or trader -- determine,
- Exact price levels where each wave should end
- Fibonacci price levels to help you further fine-tune price targets
- Support and resistance price levels -- to manage your risk
- And, ultimately, where the entire pattern will end -- and the next opportunity will begin
One Elliott wave pattern above all else signals the trend will soon end: the aptly named, Ending Diagonal. It only forms in the final position of a wave sequence -- i.e., wave 5 of a 5-wave impulse, or wave C of a correction, just as the trend is about to turn.
Most importantly, when this pattern ends, it's followed by a swift and powerful reversal that retraces the entire length of the diagonal. Here's an idealized depiction, in bull and bear markets:
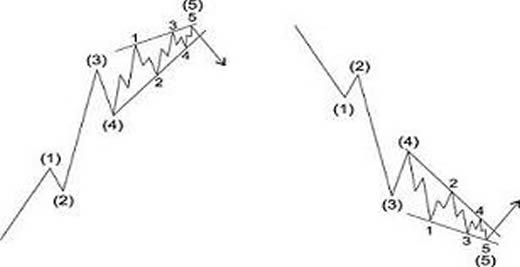
To fully appreciate the wonder of ending diagonals you have to see them in a real-world market -- like the U.S. dollar, where this pattern precipitated not one, but two of the most dramatic turning points in the buck's recent history.
First, 2009, the year the music of the world's main monetary unit was supposed to die:
- The U.S. dollar circles the drain of a 15-month low
- Global central banks accumulate the lowest proportion of new U.S. dollar reserves on record (Nov. 6, 2009 Time Magazine)
- And, the UN calls for a "new global currency to replace the dollar, proposing the biggest overhaul of the world's monetary system since World War II." (Sept. 8, 2009 Telegraph.co.uk)
Lo and behold, all the mainstream "pilots" could see was the dollar's descent continuing into total oblivion:
"Dollar Slump Persisting As Top Analysts See No Bottom... As long as the Fed maintains interest rates at historical lows, the EUR-USD should return on a bullish trend." (Nov. 23, 2009 Reuters)
Of course, you know that the Fed has kept interest rates at the same low levels, near zero, since 2009, for 6 long years -- yet EURUSD did the opposite of what the mainstream pundits expected.
On the other hand, thanks to the ending diagonal Elliott wave pattern, you knew of the coming bullish reversal in the dollar/ bearish reversal in the EURUSD ahead of time. Elliott Wave International's October 21, 2009 Short Term Update wrote:
"The [U.S. Dollar Index] still has not 'spiked beneath 74.92, the lower trendline of the fifth-wave ending diagonal that we've been discussing. Absent this price behavior, a rally above 77.48 would be another signal that a significant low is in place. Until then, we patiently wait for the current wave structure to complete."
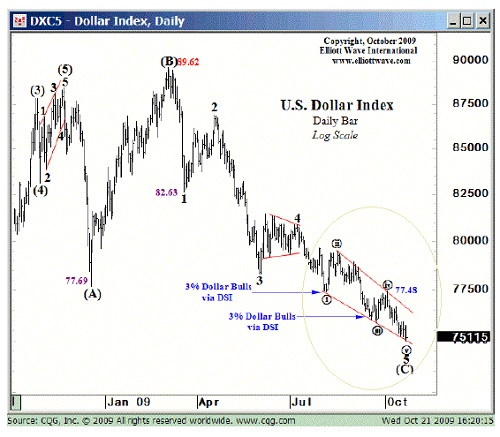
Reinforcing the bullish outlook was Elliott Wave International's October 2009 Elliott Wave Theorist (notice the ending diagonal on the dollar's price chart):
"The dollar sentiment remains bleak as night... and the wave count once again appears terminal. The coming advance in the dollar should be exceptionally powerful."
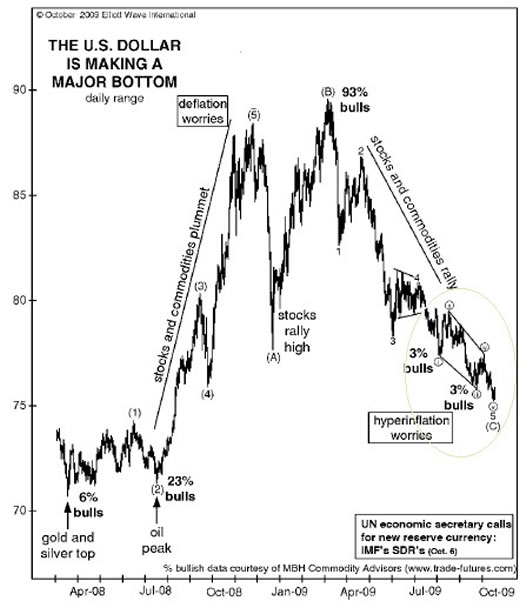
Result: As the ending diagonal pattern suggested, soon after the U.S. dollar index took off in a powerful rally to a one-year high against the euro.
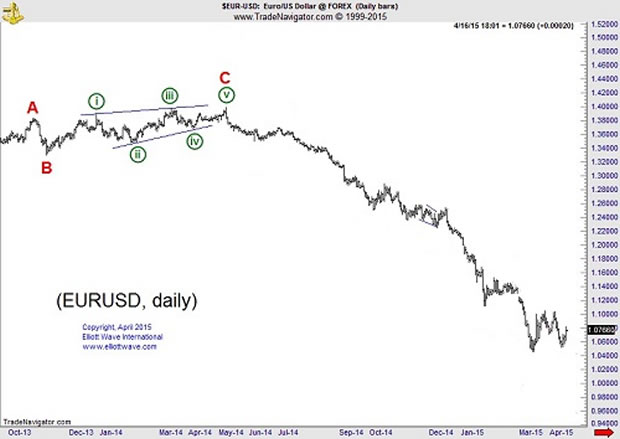
Now, flash ahead to May 2014: Once again, U.S. dollar "doom talk" is back. Against the euro, the dollar stands at a 2.5 year low, near $1.40.
This time, Elliott Wave International's June 2014 European Financial Forecast saw a bearish ending diagonal on the EURUSD price chart, suggesting another greenback comeback ahead:
"The wave labels on the chart denote the pertinent legs of the rally...Wave C of (4) traced out an ending diagonal to complete the advance. Last month, prices broke below the diagonals lower boundary, confirming the end of the large degree rally. The decline should be the first of many down waves that carry the euro lower over the remainder of 2014."
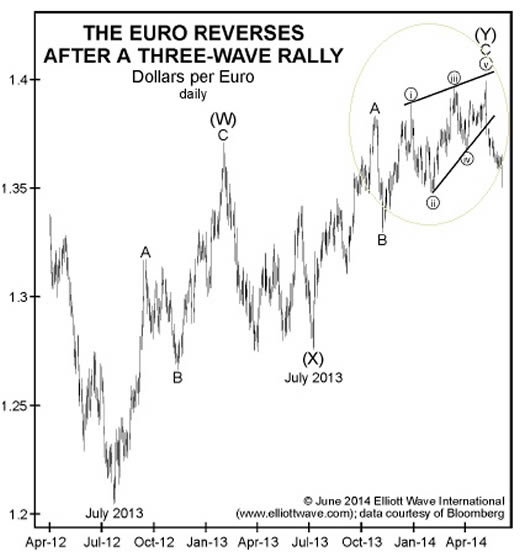
Result: From that May 2014, the U.S. dollar soared (and the euro slid) in the fastest rise in 40 years, ascending to a 12-year high against its European foil by March 2015.
This is why ending diagonals are one of the most high-confidence Elliott wave patterns. But it's just one of many. Imagine how much knowing other patterns could help you with your markets.
Free "Trader Education Week"Register now, 100% free, and get instant access to 3 insight-packed introductory trading lessons. Then each day through April 28 we will email you more free trading lessons that you can apply to your trading immediately. Register now, 100% free -- and access 3 intro lessons instantly >> |
This article was syndicated by Elliott Wave International and was originally published under the headline Why 2 of U.S. Dollar's Recent Bottoms Have 1 Thing In Common. EWI is the world's largest market forecasting firm. Its staff of full-time analysts led by Chartered Market Technician Robert Prechter provides 24-hour-a-day market analysis to institutional and private investors around the world.
About the Publisher, Elliott Wave International
Founded in 1979 by Robert R. Prechter Jr., Elliott Wave International (EWI) is the world's largest market forecasting firm. Its staff of full-time analysts provides 24-hour-a-day market analysis to institutional and private investors around the world.
© 2005-2022 http://www.MarketOracle.co.uk - The Market Oracle is a FREE Daily Financial Markets Analysis & Forecasting online publication.


