Most Popular
1. It’s a New Macro, the Gold Market Knows It, But Dead Men Walking Do Not (yet)- Gary_Tanashian
2.Stock Market Presidential Election Cycle Seasonal Trend Analysis - Nadeem_Walayat
3. Bitcoin S&P Pattern - Nadeem_Walayat
4.Nvidia Blow Off Top - Flying High like the Phoenix too Close to the Sun - Nadeem_Walayat
4.U.S. financial market’s “Weimar phase” impact to your fiat and digital assets - Raymond_Matison
5. How to Profit from the Global Warming ClImate Change Mega Death Trend - Part1 - Nadeem_Walayat
7.Bitcoin Gravy Train Trend Forecast 2024 - - Nadeem_Walayat
8.The Bond Trade and Interest Rates - Nadeem_Walayat
9.It’s Easy to Scream Stocks Bubble! - Stephen_McBride
10.Fed’s Next Intertest Rate Move might not align with popular consensus - Richard_Mills
Last 7 days
RECESSION When Yield Curve Uninverts - 8th Sep 24
Sentiment Speaks: Silver Is Set Up To Shine - 8th Sep 24
Precious Metals Shine in August: Gold and Silver Surge Ahead - 8th Sep 24
Gold’s Demand Comeback - 8th Sep 24
Gold’s Quick Reversal and Copper’s Major Indications - 8th Sep 24
GLOBAL WARMING Housing Market Consequences Right Now - 6th Sep 24
Crude Oil’s Sign for Gold Investors - 6th Sep 24
Stocks Face Uncertainty Following Sell-Off- 6th Sep 24
GOLD WILL CONTINUE TO OUTPERFORM MINING SHARES - 6th Sep 24
AI Stocks Portfolio and Bitcoin September 2024 - 3rd Sep 24
2024 = 1984 - AI Equals Loss of Agency - 30th Aug 24
UBI - Universal Billionaire Income - 30th Aug 24
US COUNTING DOWN TO CRISIS, CATASTROPHE AND COLLAPSE - 30th Aug 24
GBP/USD Uptrend: What’s Next for the Pair? - 30th Aug 24
The Post-2020 History of the 10-2 US Treasury Yield Curve - 30th Aug 24
Stocks Likely to Extend Consolidation: Topping Pattern Forming? - 30th Aug 24
Why Stock-Market Success Is Usually Only Temporary - 30th Aug 24
The Consequences of AI - 24th Aug 24
Can Greedy Politicians Really Stop Price Inflation With a "Price Gouging" Ban? - 24th Aug 24
Why Alien Intelligence Cannot Predict the Future - 23rd Aug 24
Stock Market Surefire Way to Go Broke - 23rd Aug 24
RIP Google Search - 23rd Aug 24
What happened to the Fed’s Gold? - 23rd Aug 24
US Dollar Reserves Have Dropped By 14 Percent Since 2002 - 23rd Aug 24
Will Electric Vehicles Be the Killer App for Silver? - 23rd Aug 24
EUR/USD Update: Strong Uptrend and Key Levels to Watch - 23rd Aug 24
Gold Mid-Tier Mining Stocks Fundamentals - 23rd Aug 24
My GCSE Exam Results Day Shock! 2024 - 23rd Aug 24
Orwell 2024 - AI Equals Loss of Agency - 17th Aug 24
Gold Prices: The calm before a record run - 17th Aug 24
Gold Mining Stocks Fundamentals - 17th Aug 24

Market Oracle FREE Newsletter

How to Protect your Wealth by Investing in AI Tech Stocks

Elliott Wave Analysis of Crude OIl and the US Dollar

Commodities / Gold & Silver Jun 12, 2008 - 12:03 PM GMT

By: Dan_Stinson

Commodities
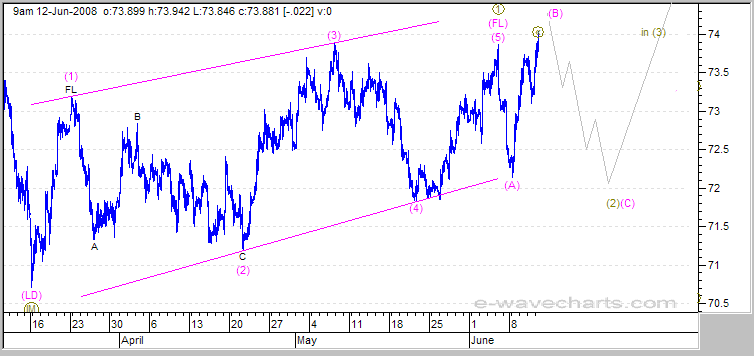
Best Financial Markets Analysis ArticleThe USD has completed a leading diagonal and is currently in a wave (2) correction. The current wave up is close to completion and we should see one more wave down to complete wave (2) down. Once this wave down completes, we should see a strong rally in wave (3) up.


Crude
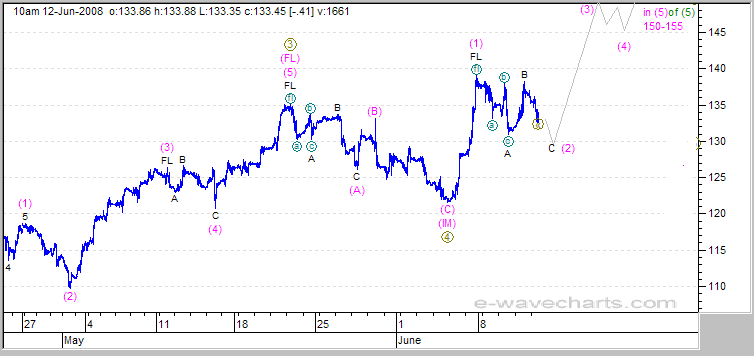
Crude is currently in a wave (2) correction in wave [5] up. We should see minor downside to the 130 area before a strong rally in wave (3) up. Once wave [5] up completes we should see a sharp decline in Crude and a strong rally for the USD. We are expecting a big reversal day to signal the top of the rally for Crude in our target area of 150-155.

The metals are also aligning for a sharp decline after the USD completes wave (2) down.

USD

Crude
These charts are only a guide so that you can follow the action and watch for the expected action. The action could play out exactly as illustrated or it may need minor adjustments as we follow it through.

If you are interested in viewing these updated charts and other detailed charts with targets on a daily basis, please see the registration details below.

Elliott Wave Chart Site - IntraDay Market Updates on the DOW, Nasdaq, S&P500, Gold, Silver, HUI and the USD.

By Dan Stinson
http://www.e-wavecharts.com

Copyright© 2001-2008

The indices covered include the NASDAQ, DOW, S&P 500, Nikkei, and DOW Transports. Commodity charts include the CRB Index, Copper, Crude, Gold, Silver, HUI and the XAU (Gold and Silver index) . Additional Elliott Wave charts cover the US Dollar (USD),CAD, Euro, 10 Year Treasury Note Yield (TNX), Nortel, Ballard Power, EBay, Encana (ECA), North American Palladium, Gold Corp, Pan American Silver, Central Fund (CEF), Couer D Alene Mines (CDE), Newmont Mining (NEM), Agnico Eagle Mines (AEM) and Denison Mines.

Dan Stinson Archive

© 2005-2022 http://www.MarketOracle.co.uk - The Market Oracle is a FREE Daily Financial Markets Analysis & Forecasting online publication.


Post Comment

Only logged in users are allowed to post comments. Register/ Log in