


Crude Oil Price Turn Coming?
Commodities / Crude Oil May 10, 2015 - 06:44 PM GMTBy: Dan_Norcini

 Crude has had a very nice recovery off its recent low set in mid-March with a steady climb of nearly $20 since that time. The push through the declining 50 day moving average was the first real clue that the complexion of this market had changed in late March with the deciding factor being the second thrust back up through it once more in early April. That cemented the low near $43 as a solid bottom in the market.
Crude Oil Continuous Contract Daily Chart

Since that time, the market has ground higher not in a sharp push but in a steady, relentless fashion indicating what can best be described as an "a reluctant abandonment of bearish sentiment" among the speculative crowd.
It does seem however that the market has met some decent resistance up near the $62 level after going straight up for the last month. The push has been unable to meet the falling 200 day moving average but it has been enough to turn the 50 day higher.
A couple of things to note here. First of all, the ADX has now finally turned down after steadily rising since the first of April. That indicates that crude has likely reached a temporary inflection point and looks to want to take a bit of a breather. Remember, a rising ADX line indicates a trending market. A turn lower represents a break or pause in that trend. It DOES NOT MEAN a trend reversal.
Crude Oil Continuous Contract Daily Chart
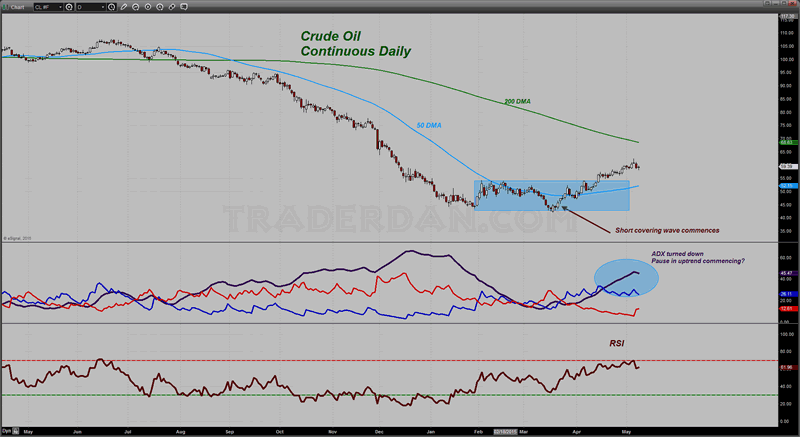
In order to see the latter, we would need to see the DMI lines cross each other with the ADX line rising as the market moved lower. Based on current readings, this looks like a pause in an ongoing bull market, albeit a grinding bull and not a bucking bull!
The RSI has backed away from its overbought status which is healthy. I should note here that overbought readings on the RSI can be worked off in two ways; by price or by time.
In the case of the former, price will retreat and move lower while the RSI moves lower with it. In the latter, price can remain relatively stagnant while time passes which allows the RSI to gradually move away from the overbought zone with little in the way of price retracements.
We will simply have to wait and see which one of these scenarios we actually get from the market.
Notice back up at the ADX/DMI indicator that the +DMI does remains above the -DMI showing the bulls still control the market on this time frame chart.
Short-term oriented Traders might want to therefore look for some potential signs of solid buying into a support zone before getting ready to move back into the long side.
Something of interest also is the Commitments of Traders report for crude oil this past week.
Here is the updated chart reflecting the total net positions of all categories of traders.
Crude Oil COT
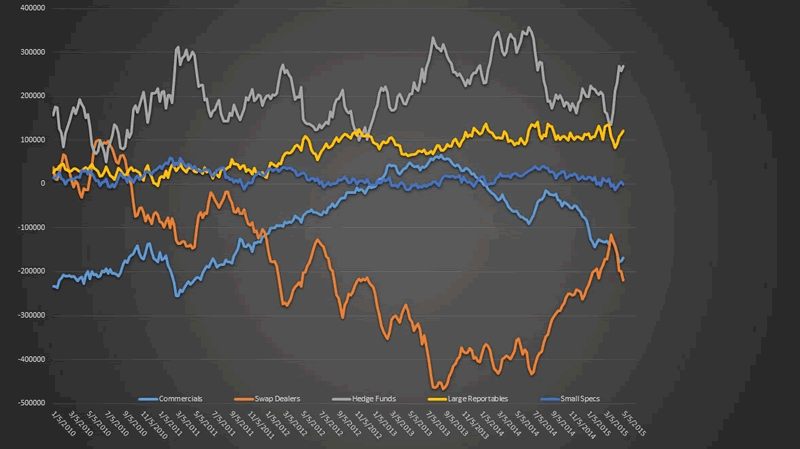
What seems to be most impressive is the sharp jump in the Hedge fund NET LONG position. It has certainly shot up quite strongly has it not? Obviously, at least one would think, the hedgies have turned strongly bullish on crude oil. The same goes for the other Large Reportables crowd as their net long position has increased as well.
The truth is that it is not so much these two groups of the large speculative forces in the market becoming wildly bullish crude as much as it is them becoming NOT BEARISH.
Here is another look at the OUTRIGHT POSITIONS of these two groups combined.
Crude Oil Outright Positions
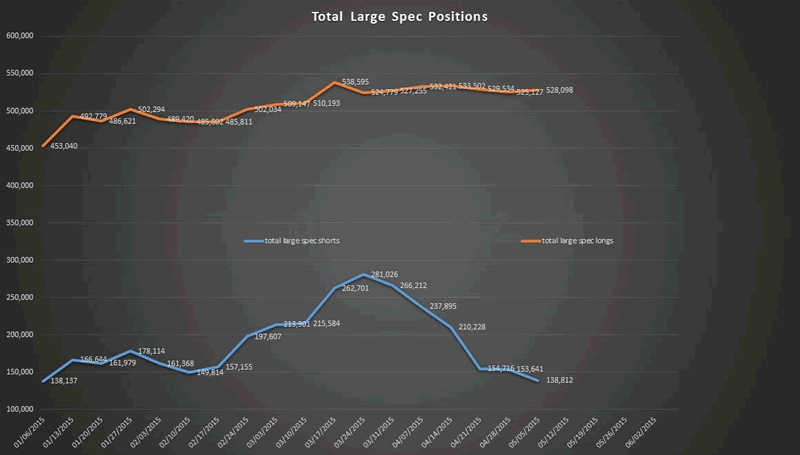
Since the time that crude oil bottomed in mid/late March, these large speculators have covered an astonishing 142K short positions. During these same period they have only added a measly 3,300 longs. That is a whopping 43:1 ratio! WOW! NO wonder this market has moved higher.
Can you see why I am saying that it is not a case of large speculators becoming wildly bullish [if it were their long positions would be soaring] but rather that they have given up on pressing crude oil lower and have exited as a result from the short side.
Short covering bouts can take a market a long way as we have seen in this case but one has to be wary since once the short covering runs it course, the market tends to fall once again since the buying is not coming from a steady influx of fresh longs. This is why I would prefer to see this market actually move lower and uncover some solid chart support levels which are accompanied by INCREASES in outright long positions by these large specs. That would tell me that we have the wind at our back in playing this market from the long side. As things now stand, buying into a market moving higher only on short covering makes me nervous.
This is the reason that I am noting that downturn in the ADX line with great interest and am not willing to ignore it.
Then again, I tend to err on the side of caution as I have long passed the phase in my trading career where I take wild risks.
Let's see what crude oil wants to do as we move forward. One thing in its favor is that we are into that time of the year that gasoline demand is at its strongest and that means refiners will be cranking out the products. This should keep oil demand strong.
The EIA numbers are also going to be important each week as we need to see this trend of declining overall US daily production continuing as well as further drawdowns at Cushing.
Dan Norcini
Dan Norcini is a professional off-the-floor commodities trader bringing more than 25 years experience in the markets to provide a trader's insight and commentary on the day's price action. His editorial contributions and supporting technical analysis charts cover a broad range of tradable entities including the precious metals and foreign exchange markets as well as the broader commodity world including the grain and livestock markets. He is a frequent contributor to both Reuters and Dow Jones as a market analyst for the livestock sector and can be on occasion be found as a source in the Wall Street Journal's commodities section. Trader Dan has also been a regular contributor in the past at Jim Sinclair's JS Mineset and King News World as well as may other Precious Metals oriented websites.
Copyright © 2015 Dan Norcini - All Rights Reserved
All ideas, opinions, and/or forecasts, expressed or implied herein, are for informational purposes only and should not be construed as a recommendation to invest, trade, and/or speculate in the markets. Any investments, trades, and/or speculations made in light of the ideas, opinions, and/or forecasts, expressed or implied herein, are committed at your own risk, financial or otherwise. The information on this site has been prepared without regard to any particular investor’s investment objectives, financial situation, and needs. Accordingly, investors should not act on any information on this site without obtaining specific advice from their financial advisor. Past performance is no guarantee of future results.
Dan Norcini Archive |
© 2005-2022 http://www.MarketOracle.co.uk - The Market Oracle is a FREE Daily Financial Markets Analysis & Forecasting online publication.