


U.S. Bond Bear Market Still Underway?
Interest-Rates / US Bonds May 12, 2015 - 11:07 AM GMTBy: Tony_Caldaro

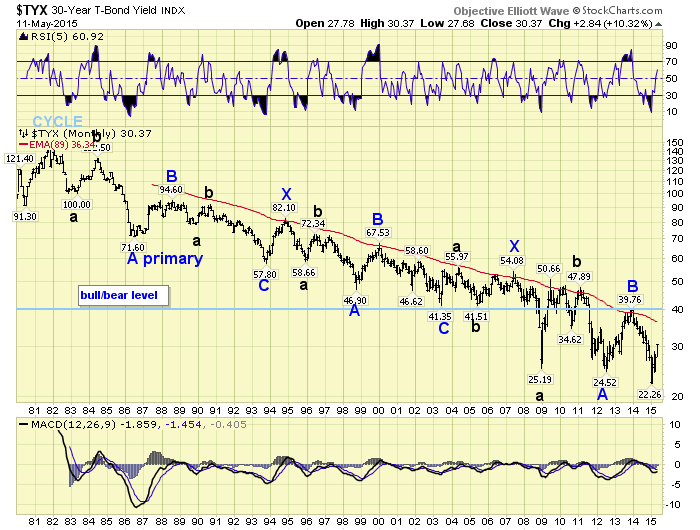
 The has been lots of talk lately of a Bond market top. This type of talk has actually been going on, and off, for a few years. To our surprise we find we have not written a Bond specific report in nearly three years: https://caldaro.wordpress.com/2012/07/02/bonds-and-long-term-rates/. In that report we detailed why we expected Bond yields to be bottoming in 2012. The 10YR did make a new yield low that year at 1.39%, and it has remained above that low ever since – currently 2.27%. The 30YR also made a new low yield that year at 2.45%. It then rose to 3.98% in 2014, but renewed its decline into a lower low at 2.23% in February of this year – currently 3.04%.
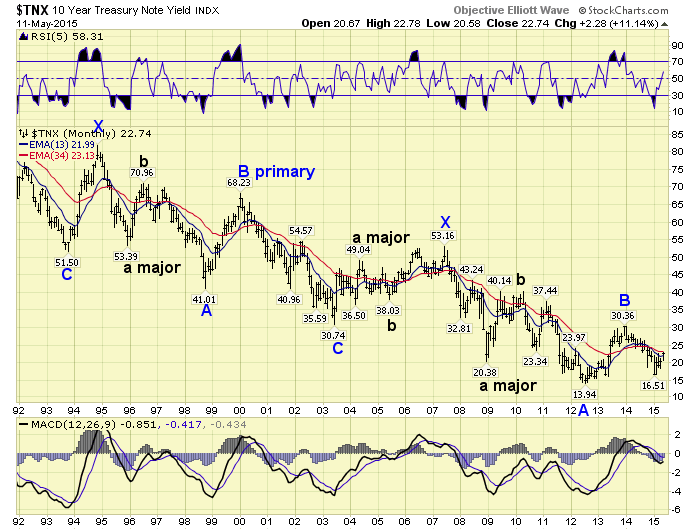
This second decline to a lower low was somewhat surprising. Especially since the 10YR yield did not make a new low as well. Since Bond yields tend to move in 34 year cycles and there is very little sound data to go on much past the last 50 years, comparisons between the two maturities are limited to the 1981 yield peak. Then the 10YR and 30YR peaked within weeks of each other in the fall of 1981. They, amazing as it may sound, have been gradually declining for the past 34 years. When one considers the peak 30YR yield in 1981 was 15.21% and the recent low was 2.23%. It is quite clear, on average, yields do not move much at all. When compared to the stock market, for example, the DOW has risen from 1,000 to 18,000 during the same period.
From an OEW perspective it is also difficult to track a 34 year series of ABCs, since corrective waves can extend and extend until they complete. This is the reason we were looking for coincident lows in the 10YR and 30YR during the 30+ year period. This may still occur, and we are currently labeling the 10YR chart with this in mind. If this does not occur another view of the 34 year yield decline may be of some help.
During the entire decline from 1981-2015 the 30YR yield has made a steady series of lower highs. In fact, every high in yield has run into resistance at the monthly 89EMA. Notice how yields have risen into that EMA, get slightly above (less than 50 bps), then immediately reverse. The current level of the EMA is 3.63%. Since this EMA has been declining steadily over the years, the high points in yield have been declining steadily too. What this suggests is once the 30YR yield rises above a previous high, the recent high was 3.98%, the bear market in yields is over. And a new 34 year bull market in yields in underway. For those who refer to Bonds in price, this would mean the bull market in Bonds is over and a new 34 year bear market is underway. However you look at it, the key levels going forward are 3.63% and 3.98%. Until the latter level is exceeded yields can still make a lower low in the months/year(s) ahead. When it is exceeded it may be prudent to await the next significant decline in yields before exiting those Bonds and Bond funds.
You can track Bonds and their Yields along with us on page 12 using the following link: http://stockcharts.com/public/1269446/tenpp/12
http://caldaroew.spaces.live.com
After about 40 years of investing in the markets one learns that the markets are constantly changing, not only in price, but in what drives the markets. In the 1960s, the Nifty Fifty were the leaders of the stock market. In the 1970s, stock selection using Technical Analysis was important, as the market stayed with a trading range for the entire decade. In the 1980s, the market finally broke out of it doldrums, as the DOW broke through 1100 in 1982, and launched the greatest bull market on record.
Sharing is an important aspect of a life. Over 100 people have joined our group, from all walks of life, covering twenty three countries across the globe. It's been the most fun I have ever had in the market. Sharing uncommon knowledge, with investors. In hope of aiding them in finding their financial independence.
Copyright © 2015 Tony Caldaro - All Rights Reserved Disclaimer: The above is a matter of opinion provided for general information purposes only and is not intended as investment advice. Information and analysis above are derived from sources and utilising methods believed to be reliable, but we cannot accept responsibility for any losses you may incur as a result of this analysis. Individuals should consult with their personal financial advisors.
Tony Caldaro Archive |
© 2005-2022 http://www.MarketOracle.co.uk - The Market Oracle is a FREE Daily Financial Markets Analysis & Forecasting online publication.