


EUR/USD Meets Resistance Zone As Greece Meets IMF Loan Repayment Deadline
Currencies / Forex Trading May 13, 2015 - 11:11 AM GMTBy: Nadia_Simmons

 Earlier today, Greece repaid a €770 million loan installment to the International Monetary Fund, easing worries that the country was on the verge of default, which in combination with a renewed selloff in European government bond pushed EUR/USD sharply higher. In this way, the exchange rate reached its important resistance zone, but will we see further improvement?
In our opinion, the following forex trading positions are justified - summary:
EUR/USD: none
GBP/USD: none
USD/JPY: none
USD/CAD: none
USD/CHF: none
AUD/USD: none
EUR/USD
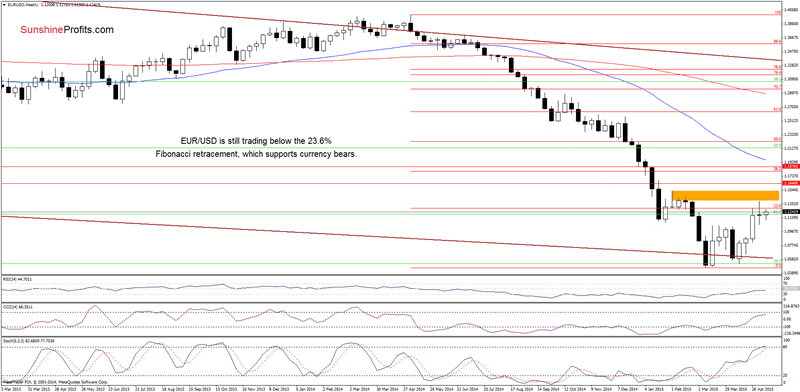
Looking at the weekly chart, we see that although EUR/USD moved little higher earlier this week, the pair is still trading under the previously-broken 23.6% Fibonacci retracement, which supports currency bears.
Will the exchange rate move lower in the coming days? Let's examine the daily chart and find out.
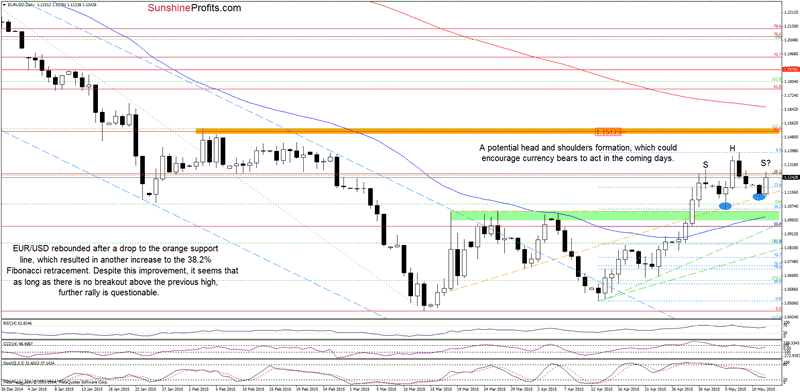
From this perspective, we see that EUR/USD rebounded after a drop to the orange dashed line. Similarly to what we saw in the previous week, this support triggered an upswing, which took the pair to the 38.2% Fibonacci retracement once again. Although this is a positive signal, we think that as long as there is no breakout above the recent high, a potential head and shoulders formation might be in play. As you see on the daily chart, if the exchange rate drops under the orange support line (which could be a neck line of the formation), we might see a bigger correction of the recent rally and a drop to at least the green support zone (around 1.1000-1.1050) supported by the 38.2% retracement (based on the recent upward move).
Very short-term outlook: mixed with bearish bias
Short-term outlook: mixed
MT outlook: mixed
LT outlook: mixed
Trading position (short-term; our opinion): No positions are justified from the risk/reward perspective at the moment.
USD/JPY
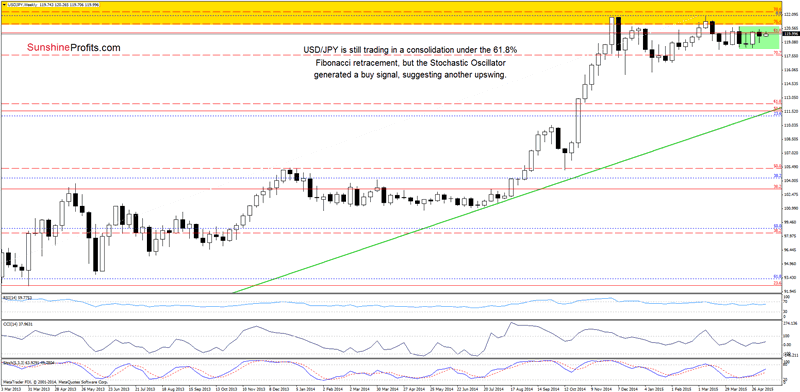
From the medium-term perspective the situation hasn't changed much as USD/JPY is still trading in a consolidation (marked with green) under the 61.8% Fibonacci retracement level, which makes the outlook a bit unclear. Nevertheless, the Stochastic Oscillator generated a buy signal, suggesting another upswing.
Having said that, let's check whether the daily chart give us some valuable clues about future moves or not.
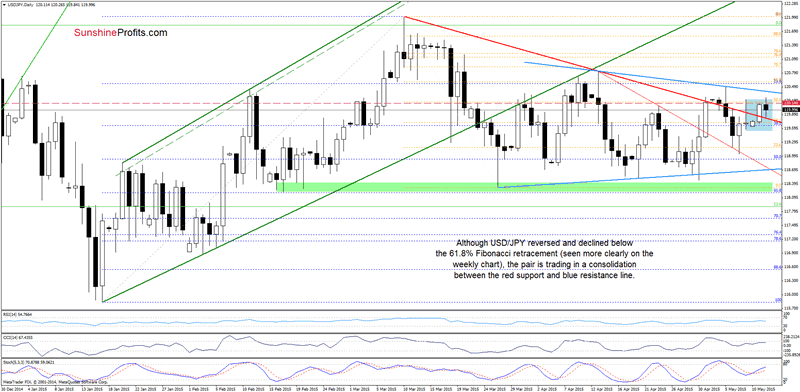
Earlier today, the exchange rate climbed to the 61.8% Fibonacci retracement (seen more clearly on the weekly chart), but this key resistance level stopped further improvement. As a result, the pair declined, but USD/JPY is still trading in a consolidation (marked with blue) above the red declining support line. In our opinion, as long as there is no breakout above the blue resistance line (currently around 120.40) or a breakdown under the lower line of the formation, a bigger move is not likely to be seen. Nevertheless, we should keep in mind that the Stochastic Oscillator generated a buy signal, supporting another attempt to move higher.
Very short-term outlook: mixed
Short-term outlook: mixed
MT outlook: mixed
LT outlook: bullish
Trading position (short-term; our opinion): No positions are justified from the risk/reward perspective at the moment.
USD/CAD
The situation in the medium term hasn't changed much as USD/CAD is still trading above the 38.2% Fibonacci retracement. Today, we'll focus on the very short-term changes.
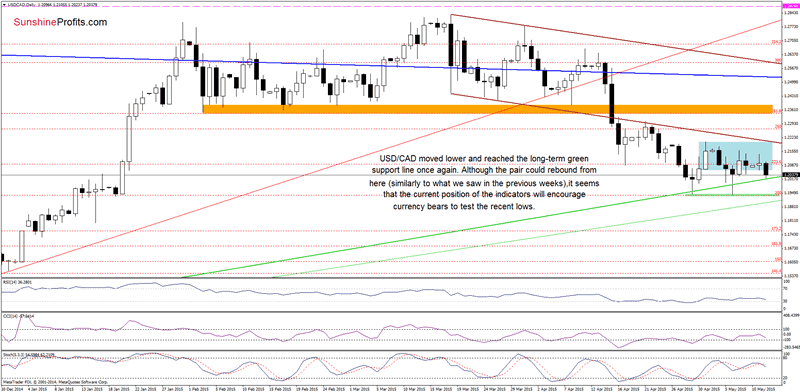
On the above chart, we see that USD/CAD moved lower and dropped to the long-term green support line once again. Although the pair could rebound from here (similarly to what we saw in the previous weeks), it seems that the current position of the Stochastic Oscillator (the indicator generated a sell signal) will encourage currency bears to test the strength of the support zone based on the recent lows (around 1.1940) in the coming days.
Very short-term outlook: mixed
Short-term outlook: mixed
MT outlook: mixed
LT outlook: mixed
Trading position (short-term; our opinion): No positions are justified from the risk/reward perspective at the moment.
Thank you.
Nadia Simmons
Forex & Oil Trading Strategist
Przemyslaw Radomski
Founder, Editor-in-chief
Sunshine Profits: Gold & Silver, Forex, Bitcoin, Crude Oil & Stocks
Stay updated: sign up for our free mailing list today
* * * * *
Disclaimer
All essays, research and information found above represent analyses and opinions of Nadia Simmons and Sunshine Profits' associates only. As such, it may prove wrong and be a subject to change without notice. Opinions and analyses were based on data available to authors of respective essays at the time of writing. Although the information provided above is based on careful research and sources that are believed to be accurate, Nadia Simmons and his associates do not guarantee the accuracy or thoroughness of the data or information reported. The opinions published above are neither an offer nor a recommendation to purchase or sell any securities. Nadia Simmons is not a Registered Securities Advisor. By reading Nadia Simmons’ reports you fully agree that he will not be held responsible or liable for any decisions you make regarding any information provided in these reports. Investing, trading and speculation in any financial markets may involve high risk of loss. Nadia Simmons, Sunshine Profits' employees and affiliates as well as members of their families may have a short or long position in any securities, including those mentioned in any of the reports or essays, and may make additional purchases and/or sales of those securities without notice.
Nadia Simmons Archive |
© 2005-2022 http://www.MarketOracle.co.uk - The Market Oracle is a FREE Daily Financial Markets Analysis & Forecasting online publication.