


Gold Price Seasonals Bottoming
Commodities / Gold and Silver 2015 Jun 12, 2015 - 03:56 PM GMTBy: Zeal_LLC

 Gold remains deeply out of favor, languishing near major lows. Traders are still convinced gold is going nowhere, and want nothing to do with it. But provocatively that’s par for the course in early June, when gold slumps to its most-important seasonal low. Gold’s seasonals are now bottoming, just ahead of the usual major surges in global gold demand coming in late summer and autumn. This is a fantastic time to buy.
Seasonality describes the strong repeating tendencies of some assets’ prices to behave in certain ways at certain times throughout the calendar year. It is driven by consistent changes in supply and demand that are tied to the seasons. Wheat is a great example, as its supply fluctuates considerably based on celestial mechanics. Harvest times naturally yield big new supplies, which tend to drive down prices.
Gold’s seasonality is somewhat counterintuitive. Unlike the grown commodities, this metal is mined globally at a steady pace year-round regardless of sunlight, temperature, or weather. But supply is only half of the price-defining equation. It’s gold’s demand that ramps up dramatically at certain times during the calendar year. Since mined supply is effectively fixed in the short-term, it can’t swell to meet these big demand surges.
So when they arrive, gold’s price is quickly bid higher. This commodity’s seasonality is totally demand-driven. There are two major components to worldwide gold demand, jewelry and investment. And over in Asia, these are often synonymous. Families plow surplus income into gold jewelry which they prize for its adornment beauty, but it is considered an investment. Investment demand at the margin sets gold prices.
And in these lazy days of early summer, global gold investment demand retreats to its lowest levels of the calendar year. This is simply a summer thing, nothing more. All the world’s major gold-demanding regions of Asia, Europe, and the US are located in the northern hemisphere, so they experience summer simultaneously. Then traders’ collective focus drifts from markets and investing to vacations and leisure.
This first chart illustrates how gold prices tend to slump to major seasonal lows in June. Teasing out seasonal tendencies requires averaging price fluctuations across many years. But gold’s price varies dramatically over time. For example it averaged around $275 in 2001, price levels that certainly aren’t comparable to the $1575 in 2011. While a $12 daily gold move is nothing today, it was epic 14 years ago.
So to render many years of gold price action in perfectly comparable terms, each calendar year has to be individually indexed. Gold’s closing price on the final day of the previous year is recast at 100, with the entire year’s daily percentage moves indexed off that. So at an index level of 110, gold is up 10% year-to-date regardless of its prevailing price levels. All of these individual calendar-year indexes are then averaged.
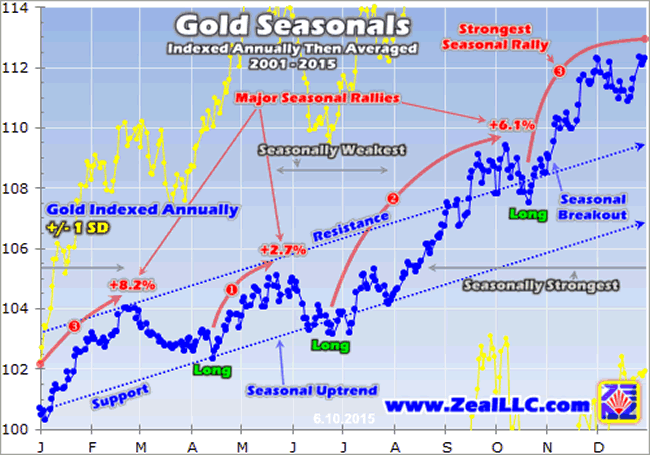
And voila, here’s the result of 14.5 years of daily gold-price data plugged into a 10k-formula spreadsheet! Running from 2001 to 2015, this reveals gold’s indexed percentage price action as averaged across all calendar years. This metal indeed has very pronounced seasonal tendencies! It tends to rally and slump at certain times of the calendar year depending on global investment demand. Check out early June.
Gold tends to suffer a sharp selloff as the market summer dawns and investors and speculators leave their computers to venture out into the glorious sunshine. This is actually gold’s sharpest seasonal selloff of the entire calendar year. Gold is nearly always down in the dumps in early summer, wallowing in apathy and antipathy. But before we delve deeper into gold’s seasonals, this is the wrong chart to use.
Since price action is radically different in bull and bear markets, seasonality isn’t really comparable across that great divide. Between 2001 and 2012, gold was inarguably in a strong secular bull market. From April 2001 to August 2011 in particular, gold soared 638% higher! It was the best-performing asset class in the world by far, trouncing the flagship US S&P 500 stock index’s 2% loss over that same span.
After such an epic wealth-multiplying bull run, gold consolidated those gains in 2012. It rallied strongly again late that summer before slamming into the most extreme market anomaly of our lifetimes. In late 2012 the Fed launched its QE3 campaign of conjuring vast amount of dollars out of thin air to monetize debt. QE3 was far different from QE1 and QE2, being totally open-ended. This was wildly unprecedented.
The Fed kept actively trying to convince global investors and speculators that it would be quick to step in and ramp up QE3’s bond buying if there was any material stock-market selloff. Traders gradually came to the belief that the Fed was backstopping stock markets, that they had miraculously become riskless. So traders quickly scrambled to buy every dip, short-circuiting normal healthy sentiment-rebalancing selloffs.
The resulting Fed-fueled stock-market levitation radically distorted world markets. Prudent diversification of portfolios across asset classes was forgotten as traders lusted after those central-bank-goosed stock markets. Alternative investments, led by gold, were abandoned. This extremely anomalous shift peaked in the second quarter of 2013, when gold plummeted 22.8% on record selling in the dominant GLD gold ETF.
That was gold’s worst quarterly performance in an astounding 93 years, an ultra-rare once-in-a-century superstorm! That single quarter forced gold down 27.9% in 2013, well into bear-market territory. That was the most aberrant gold year we’ll witness in our lifetimes, as far from normal as imaginable. And obviously 2013 is averaged into the seasonal gold chart above, distorting and skewing normal gold seasonals.
Thankfully gold’s extraordinary Fed-distortion-driven bear was largely confined to 2013. Gold stabilized in 2014 with a trivial 2% loss, and is dead-flat so far this year. So technically, gold’s bear market is long over. And the vast amounts of capital the Fed’s stock-market levitation sucked out of gold in 2013 are almost certain to return as both stock markets and gold mean revert back out of these extreme anomalies.
Since it’s essential to separate out the opposing bull and bear seasonals, this next chart offers a much-more-accurate view of gold’s intra-calendar-year price tendencies. It individually indexes and then averages gold’s price behavior between 2001 and 2012. Excluding that incredible aberration of 2013 offers a far-clearer view of gold’s seasonality. And again right now, gold is experiencing its major seasonal low.
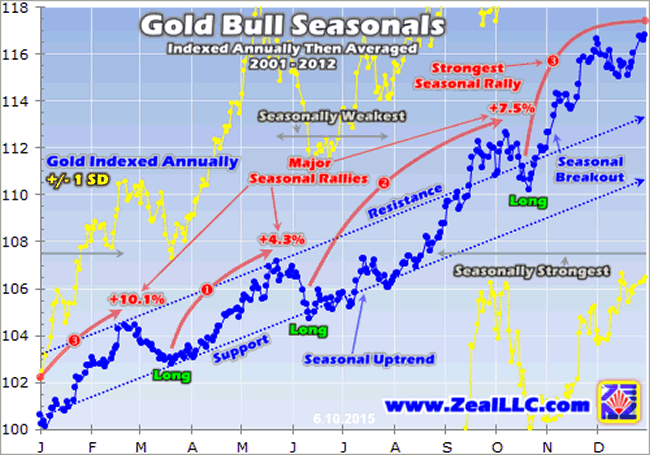
The typical sharp selloff gold suffers in early June as summer seduces investors away leads to gold’s most-important seasonal bottoming of the calendar year. On average gold bottoms on the tenth trading day of June, which happens to be the very day this essay was published. This marks the absolute single best time of the year in pure seasonality terms to aggressively invest in gold, silver, and their miners’ stocks!
Gold’s second-strongest seasonal rally of the year starts marching higher from this summer-doldrums sentiment wasteland. On average between 2001 and 2012 before the Fed’s extreme market distortions, gold powered 7.5% higher between mid-June and early October. The factors that drive the strong surge in gold demand in August and September are well-known. They center around Asia’s ancient love affair with gold.
Gold starts climbing in late June and July because smart Western investors are front-running the usual big surges coming in Asian demand. With India and China in the northern hemisphere, their farmers share the same growing and harvest seasons we have in the States. And after an entire year’s hard work and heavy investment, harvests are reaped. Asian farmers finally know how much surplus income they earned.
Then they plow some of their year’s savings into physical gold bullion, a wise investment throughout virtually all of world history. This may seem quaint to us in the West, but we do the same thing. There is a big investment surge (stocks and gold) in the US in late December and early January, right after we figure out how much surplus income we earned during the year after bonuses are paid and tax burdens calculated.
Asian harvest buying gradually gives way to India’s famous festival season, the auspicious time when young Indian couples want to get married. Weddings are often arranged by parents, and they believe festival-season weddings have greater odds of yielding long, successful, happy, and lucky marriages. And gold has long been an integral part of India’s elaborate and fascinating weddings. So it is bought heavily.
The families of Indian brides pay fortunes to outfit them with extensive gold dowries. Much of this is in the form of beautiful and intricate 22-karat jewelry the bride can wear on that most-important day of her life. This gold jewelry is not just an adornment, but secures brides’ financial independence within their husbands’ families. Parents spare no expense in providing this gold for their precious daughters getting married.
So Indian gold demand soars in September, pushing world gold prices higher. While recently overtaken by China, India had long been the world’s biggest gold consumer. And something like 40% of its entire massive annual gold demand occurs during this autumn wedding season! Smart contrarian investors and speculators start buying into the precious-metals sector in June and July ahead of this clockwork surge.
Gold suffers another sharp seasonal selloff in mid-October, but then starts powering higher in its best seasonal rally of the calendar year. Between early October and late February, this metal blasted another 10.1% higher on average between 2001 and 2012. And much of the marginal new gold demand fueling this excellent rally comes from the West, where we enter our own cultural festival season leading into Christmas.
Between Thanksgiving and Christmas, the majority of annual American and European discretionary spending occurs. Part of this feeds a mammoth surge in demand for gold jewelry for Christmas gifts for wives, girlfriends, daughters, and mothers. Many Western jewelers reportedly do half of their entire year’s sales between Thanksgiving and Christmas! All that buying pushes gold prices sharply higher.
The strong marginal gold demand persists in late December and January, but shifts to pure investment. Once again that’s when we Westerners figure out how much surplus capital we earned that year, just like the Asian farmers after harvest. Then we either decide for ourselves where to put this money to work or send it to professionals to invest it for us. So there are big capital inflows into gold during this new-year season.
After that, Chinese gold demand takes the baton in February. The Chinese calendar isn’t solely driven by solar cycles like here in the West, but also lunar cycles. So the popular Chinese New Year and surrounding festivities arrive sometime between late January and mid-February. The Chinese buy gold aggressively then for both investments and gifts, helping propel gold to another major seasonal peak.
Provocatively right now at gold’s major June seasonal low is the best time to deploy capital in gold to ride all of these coming income-cycle and cultural drivers of outsized gold demand! Unfortunately the great majority of investors and speculators are too short-sighted to buy gold low when it is deeply out of favor. They’ll instead buy in higher later, after much of gold’s coming seasonal gains have already been won.
This last chart slices the gold-bull seasonality between 2001 and 2012 a different way, monthly. Each calendar month is individually indexed, with the final close on the last day of the previous month being set at 100. And then all the like calendar months’ indexes are averaged across years. While early June is gold’s weakest time of the year, it precedes some of gold’s best months in August and September.
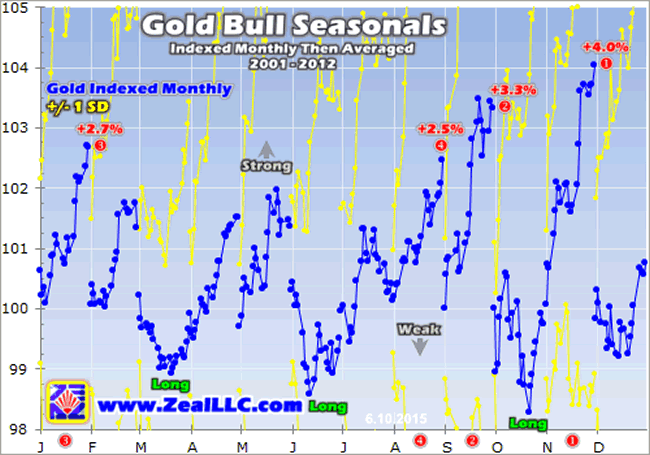
The first part of June is gold’s second-worst monthly time seasonally after mid-October. Combining this early-June selloff with its late-May lead-in marks gold’s sharpest seasonal selloff of the year. But taking advantage of this typical early-summer weakness to buy low makes great sense. Gold’s average gains in August and September between 2001 and 2012 ran 2.5% and 3.3%, its fourth- and second-best months!
So with gold seasonals bottoming, right now is the best time of the year to deploy capital in gold and the entire precious-metals realm driven by its price. Smart investors and speculators buy in low when few others want to and sentiment is miserable, because that’s when the cheapest prices are found. While it isn’t easy psychologically bucking the crowd and investing in something unpopular, this yields the greatest gains.
But unfortunately only a tiny fraction of traders will have the courage to pull the trigger. Thanks to that extreme Fed-driven anomaly in 2013, and its technical and sentimental aftermath still plaguing gold to this day, many traders believe gold’s seasonality has been short-circuited. Since gold’s seasonals didn’t work well in recent years, these traders expect them to remain forever broken. But this is a supremely-irrational assumption.
Gold’s seasonality has existed for many decades, if not centuries. Nothing is going to change the timing of Asian harvest, Indian wedding season, Western holiday buying and year-end, or Chinese New Year. These are deeply-ingrained income-cycle and cultural drivers of outsized gold demand that will certainly persist for decades if not centuries to come. An extreme central-bank-fueled anomaly can’t overwhelm them for long.
I suspect that critical core market principle of mean reversion after anomalous extremes also applies to seasonality. Odds are gold’s seasonality is due to come roaring back with a vengeance after being artificially suppressed in recent years. The alternative bet makes no sense, that gold’s once-in-a-century superstorm in 2013 will somehow define the new norm. There’s no doubt gold’s seasonality will indeed reassert itself.
A second objection to seizing this major gold seasonals bottoming to buy low arises due to the looming threat of the Fed’s coming interest-rate hikes. Investors and speculators alike are convinced that gold is in mortal peril when rates are forced higher, since it has no yield. But history shatters that silly fallacy too. Gold actually thrives in rising-rate and high-rate environments, as I’ve researched extensively.
During the Fed’s last rate-hike cycle between June 2004 to June 2006, it more than quintupled its benchmark Federal Funds Rate from 1.0% to 5.25%. Yet gold blasted 50% higher over that exact span! In the 1970s, gold skyrocketed a staggering 24.3x higher while the Fed catapulted its FFR from 3.5% in early 1971 to an astounding 20.0% by early 1980! Higher rates hurt stocks and bonds, attracting investors back to gold.
So instead of being a threat, the Fed’s coming rate-hike cycle is likely to prove the catalyst that reignites gold’s slumbering seasonality. And that means outstanding gains are coming in gold, silver, and the stocks of their miners. Investors and speculators can play gold’s coming strong seasonal rallies in gold itself or the flagship American GLD gold ETF. But their gains will be dwarfed by those in the gold stocks.
Since gold has been so far out of favor for so long, the gold miners have been left for dead. Long since abandoned, they’ve been trading at truly fundamentally-absurd levels relative to the price of gold which drives their profits and hence ultimately their stock prices. So the best of the gold miners are the place to be to really leverage the upcoming gains in gold! They are going to soar as gold’s seasonality returns.
At Zeal we’ve long specialized in this ultimate contrarian realm. We’ve been aggressively buying elite gold and silver stocks recently to take advantage of gold’s seasonal bottoming. All these trades have been detailed in our acclaimed weekly and monthly subscription newsletters. They draw on our exceptional market experience, knowledge, and wisdom forged over decades to explain what’s going on in the markets, why, and how to trade them with specific stocks. Our long-term track record is stellar. Since 2001, all 700 stock trades recommended in our newsletters have averaged annualized realized gains of +21.3%! Subscribe today before gold rallies and our popular 33%-off sale ends!
The bottom line is gold exhibits strong seasonality, created by surges in global demand throughout the calendar year. While this has been suppressed in recent years by the Fed-fueled extreme market distortions, that anomaly is only temporary. The underlying income-cycle and cultural drivers of these periods of outsized gold demand have been around for many decades if not centuries, and will persist for many more.
And right now gold is experiencing its most-important seasonal bottoming as it languishes in early summer’s sentiment wasteland. These early-June gold lows precede this metal’s two biggest seasonal rallies of the year, leading to major gains on average. So smart contrarian investors and speculators should be backing up the truck to load up on incredibly cheap gold, silver, and the stocks of their best miners.Adam Hamilton, CPA
So how can you profit from this information? We publish an acclaimed monthly newsletter, Zeal Intelligence , that details exactly what we are doing in terms of actual stock and options trading based on all the lessons we have learned in our market research. Please consider joining us each month for tactical trading details and more in our premium Zeal Intelligence service at … www.zealllc.com/subscribe.htm
Questions for Adam? I would be more than happy to address them through my private consulting business. Please visit www.zealllc.com/adam.htm for more information.
Thoughts, comments, or flames? Fire away at zelotes@zealllc.com . Due to my staggering and perpetually increasing e-mail load, I regret that I am not able to respond to comments personally. I will read all messages though and really appreciate your feedback!
Copyright 2000 - 2015 Zeal Research ( www.ZealLLC.com )
Zeal_LLC Archive |
© 2005-2022 http://www.MarketOracle.co.uk - The Market Oracle is a FREE Daily Financial Markets Analysis & Forecasting online publication.