


In depth Market Wrap - US Economy and Financial Markets
Stock-Markets / Financial Markets Mar 12, 2007 - 09:18 PM GMTBy: Douglas_V_Gnazzo

The Economy : Jobs
The economy added 97,000 jobs in February, which was below last month's 146,000 increase. The employment rate fell to 4.5% from 4.6%.
Employers in the U.S. added 97,000 jobs last month, less than in the prior month, as a slowing housing market and the return of winter weather prompted job cuts in construction. The unemployment rate fell.
Construction reported the largest loss of jobs in 15 years, reflecting the weakness in the housing and real estate markets. Builders let go off 62,000 workers.
Manufacturers reduced jobs by 14,000 after cutting 2,000 jobs the prior month. Our manufacturing base continues to decline, which makes it near impossible to reduce the trade deficit.
Average hourly earnings rose 6 cents, or 0.4%, after rising 0.2% the prior month. Earnings were up 4.1% from February 2006.
The chart below shows real disposable income versus real consumer spending.
Inventories
The Commerce Department reported that manufacturers are cutting back on hiring as they try to reduce excess inventories. Consequently, orders placed with U.S. factories fell 5.6%.
Average weekly hours fell to 33.7 from 33.8. Average weekly earnings rose to $578.29 last month from $577.98 in January.
The Federal Reserve released its beige book report that showed: "wage pressures increased slightly in several districts, although pay increases generally remained moderate across the country. Most districts noted further expansion in labor markets and continued tight supply of skilled and professional workers."
Inflation
Michael Moscow, President of the Federal Reserve Bank of Chicago, said he was more concerned with high inflation risk then a slowing down of the economy. That's one side, or his side - of the story.
The other side is that weakness in housing is starting to filter through the economy and is having a negative impact. The economy expanded at an annual rate of 2.2% in the fourth quarter, compared to 4.1% average rate in the first half of the year.
A thought to consider: might it be possible for both scenarios to occur at the same time?
Trade Gap
The Commerce Department reported that the U.S. trade deficit fell 3.8% to $59.1 billion in January, from $61.5 billion the previous month. Exports rose 1.1% to $126.7 billion in January from $125.3 billion a month earlier.
The trade gap with China widened to $21.3 billion in January from $19 billion a month earlier.
The chart above shows a very negative long term trend forming: the U.S. goods and services deficit widened in 2006 (revised), according to the U.S. Bureau of Economic Analysis and the U.S. Census Bureau. The deficit increased $48.5 billion from $716.7 billion in 2005 to $765.3 billion in 2006, as imports increased more than exports.
U.S. Treasury Secretary Henry Paulson has just returned from a four-day trip to Asia. Upon arriving back stateside, he stated that China needs to move faster in opening its capital markets, including allowing the yuan to fluctuate more freely.
Paulson recommends that China should move their economy away from dependence on exports, which would help reverse what Paulson warned, is a clarion call by U.S. "lawmakers" to retaliate with trade protection - the keystone to non-free markets.
Congress is considering legislation for sanctions against nations (China) that manipulate their currencies, as well as charging duties on imports from China to compensate for government subsidies.
You might want to check where you stand on such "free trade" issues, and where your representatives stand as well. Perhaps they are not representing you as you may have thought they were. Just a thought.
Another thought: does the U.S. manipulate its currency? Should we sanction ourselves if we do? Or should others sanction us if we do?
China Reserves
China's Finance Minister Jin Renqing, said that China plans to set up an agency to manage its $1.07 trillion of currency reserves. It would be Asia's largest government-controlled investment fund.
China is the world's second-largest holder of U.S. Treasury bonds (Japan#1), and now invests most of its currency reserves in dollar assets. The world now wonders where all the money is going to go to. My guess - in stuff that hurts if you drop it on your foot.
Bernanke
Federal Reserve Chairman Ben S. Bernanke said that Fannie Mae and Freddie Mac, the largest sources of money for U.S. home loans, should sell most of their $1.4 trillion in assets to refocus on homeownership among low-income Americans. Not a totally remiss idea.
He also stated that the companies could destabilize financial markets should they fail to hedge their assets against risks like shifts in interest rates. You don't say.
Bernanke said that less than 30% of the government-chartered companies' mortgage assets, or about $420 billion, go toward "affordable" housing.
Treasury Secretary Paulson is on the record as saying that the Treasury should allow a new regulator to decide whether their assets should be cut.
Question: Is there such a thing as affordable housing?
New Century
New Century Financial Corporations stock has plunged almost 90% this year, and has stopped making new loans. Analysts speculate the company may soon file for bankruptcy protection. Good idea. A better idea would have been to run the company in a fiscally responsible manner.
For example: total mortgage production at New Century in 2006 was $59.8 billion . New Century said in February that it had $350 million of cash and other liquid assets at the end of 2006. Yesterday, the company said it wasn't able to post $70 million of the $150 million its lenders have demanded as collateral.
New Century Financials problems are starting to become other's problems, as commercial banks and Wall Street firms, who have lent billions of dollars to them, begin to realize they are not going to get paid back. Some of the lenders are: Barclays, Morgan Stanley, UBS, Deutsche Bank, and Bear Stearns.
Regarding other subprime news: rising mortgage defaults by subprime borrowers may add more than 500,000 homes to the residential real estate market, which is not feeling that well, as it is. The trickle down theory appears to be alive and well - perhaps more so then the unreal estate market; another reminder that debt is a four letter word.
And yet another reminder: speculators withdrew a record $8.9 billion from emerging-market equity funds last week, during the worldwide stock market debacle.
Gold
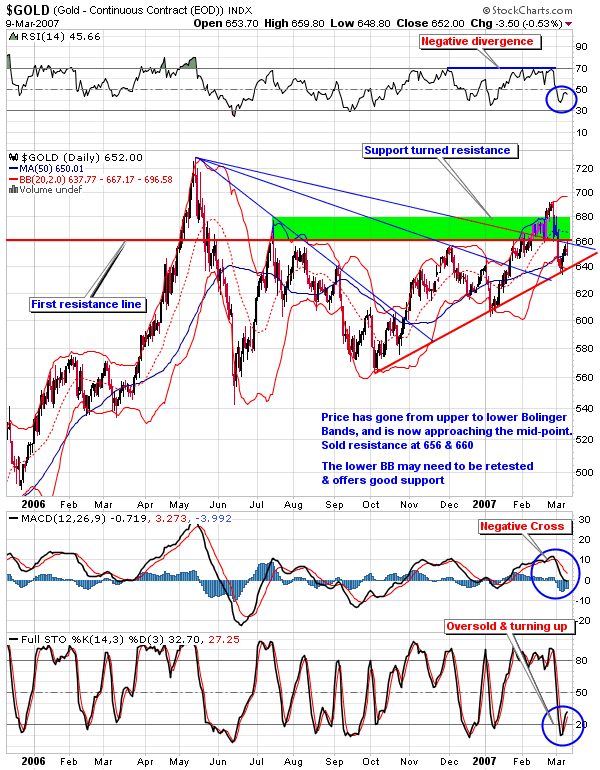
Gold closed up $7.90 for the week to $652.00 (continuous contract) or +1.23%. It had a higher close the prior two days, and an intra-day/week high of $659.80 on Friday.
This indicates that as of now, rallies are being sold into, as gold moves from weak hands to stronger hands. Overhead supply/resistance remains - needing to be worked off, which is occurring. The process takes time. It does not happen overnight.
The next target is a close above $656.00, then the resistance zone from there to $675.00. From there the supply begins to lessen considerably.
The price has traveled to the upper limit of the Bolinger Bands and back down to the lower limits. Presently it is approaching the mid-point. The upper band should act as resistance, and the lower band as support.
Different indicators on the chart are flashing positive, while others are flashing negative. It is a mixed bag as of now. Next week should decide the way to be taken.
Several sentiment indicators such as the put to call ratio, upside versus downside volume, and stochastic readings are showing oversold pessimism. From a contrarian viewpoint this is positive.
However, the indicators that are presently flashing negative readings should soon begin to turn up, as an increase would indicate further negative divergence and resulting price weakness.
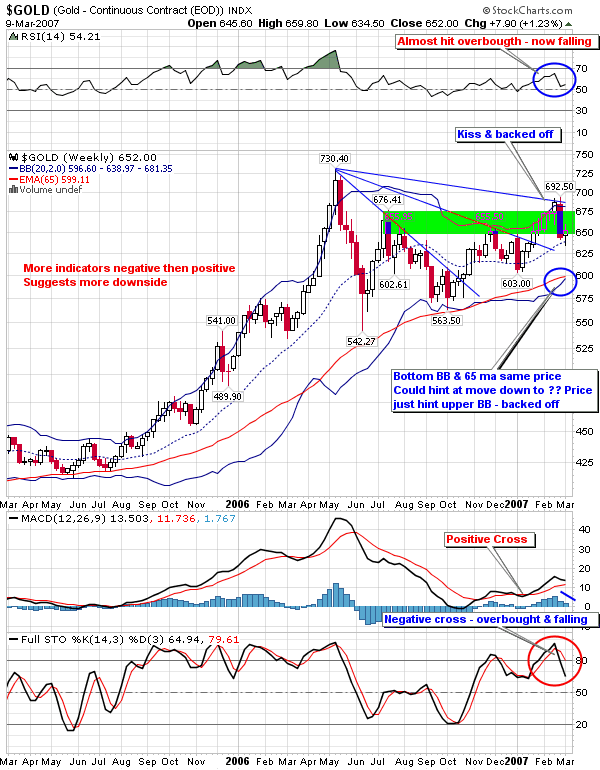
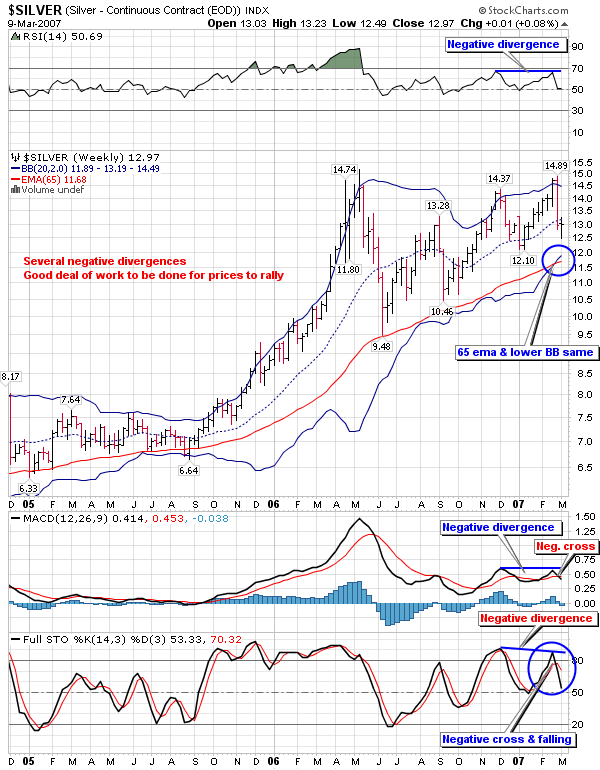
Also, on the weekly chart that follows the daily chart, there are even more negative indicators. Both the lower Bollinger band AND the 65 ema are at the SAME price.
The POG recently hit its upper BB and then backed off. This kiss and run could mean a move to the lower BB may occur. It doesn't have to, but it could.
Presently the POG just kissed its upper trend line and also backed off. Caution is warranted.
Silver/Gold Ratio
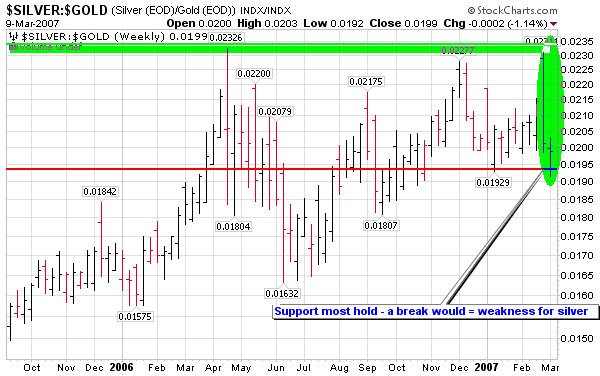
Silver has been out performing gold for some time now, as the chart below shows. The higher the number the stronger silver is. The lower the number the stronger gold is.
From Oct. of 2006, silver has had four "waves" up out performing gold. Overall the trend favored silver. Notice the three peaks at 0.02326, 0.02277, & 0.02311.
This area has acted as strong overhead resistance on three occasions now. Recently it kissed this level again and then fell quickly & sharply. Support was breached but price closed back above.
This support level must hold, as a breach would indicate further weakness in silver - at least compared to gold. Recall, however, that the weekly chart of gold showed several negative indicators.
Silver
The next chart of silver seems to indicate that a buying opportunity may be close at hand. As the chart shows, the last three times that RSI was near 30 (oversold), MACD & STO indicators were also oversold & the bottom of the BB's were near. Is the same set-up occurring again??
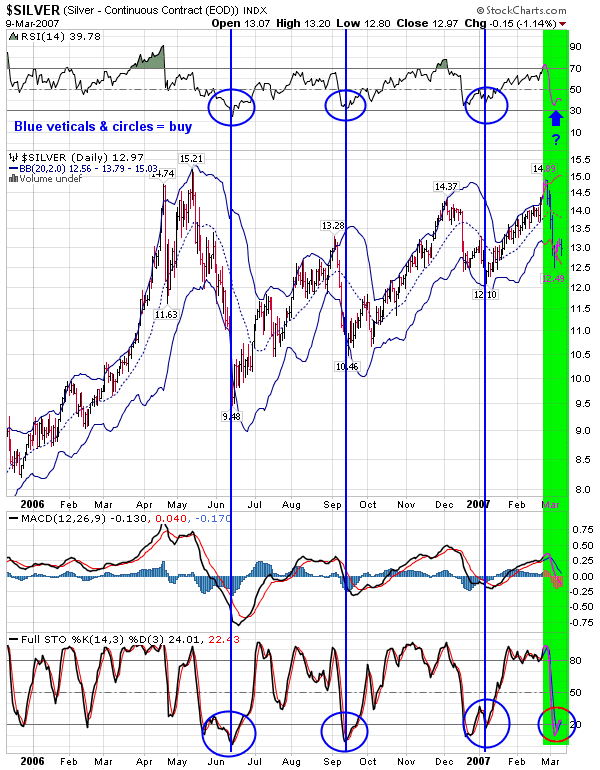
Thus the signals are mixed. Guarded optimism with caution is warranted.
The weekly silver chart shows many negative divergences. Caveat Emptor!
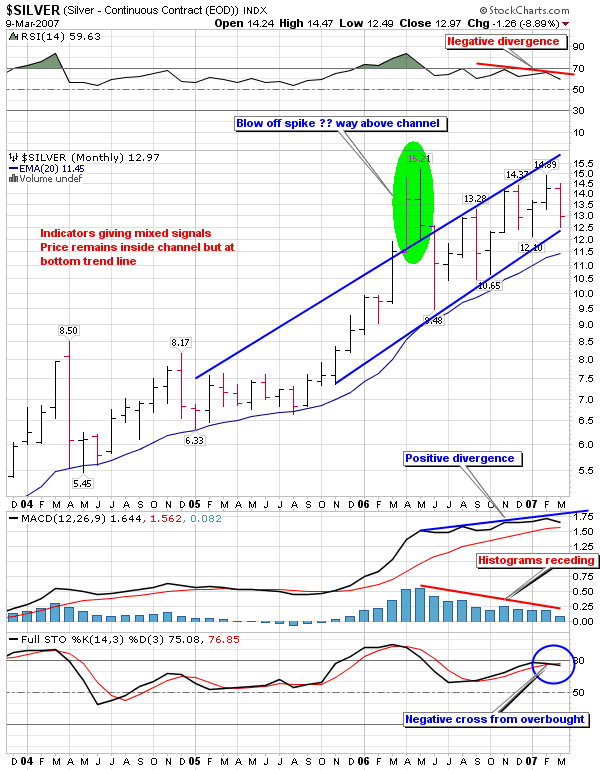
Now let's see what the monthly chart of silver shows: another mixed bag??
Xau
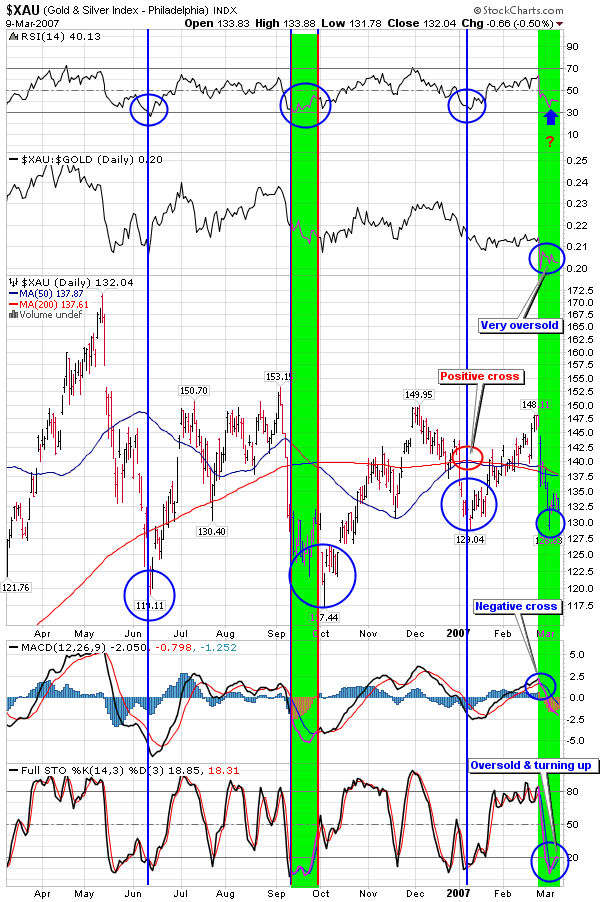
The Xau closed the week out at 132.04, down -0.31 or -0.23%. It was not the low close of the week - that distinction went to Monday's close of 129.28. The intra-week low was 128.83 and the intra-week high was 132.29.
Worthy of note is the Gold/Xau ratio is presently at 4.92 Readings of 5 are very strong buy singles (marking bottoms). It's possible that this ratio may go above 5, and if it does I'll be in there buying. Gold = 650 and Xau = 132.04 = 4.92.
The chart below of the Xau shows the Xau/Gold ratio, which is at 0.20 = an extreme oversold reading consistent with past bottoms. It is simply the inverse of the above ratio. They both express the same relationship or ratio.
Also, note that the Xau did not better its Dec. 2006 high - thus putting in a lower high (so far). It also made a lower low then its Jan. 2007 low, but a higher low from its Oct. 2006 low.
Once again a mixed bag of signals, however, in a bull market one buys weakness and sells strength. The present signals show very oversold/weakness readings consistent with past bottoms.
Thus the weight of the evidence goes to the buy side. Unless the bull turns into a bear - the present level(s) warrant incremental accumulations of positions. It's a bull market until it isn't, and as of now - it is.
Hui Index
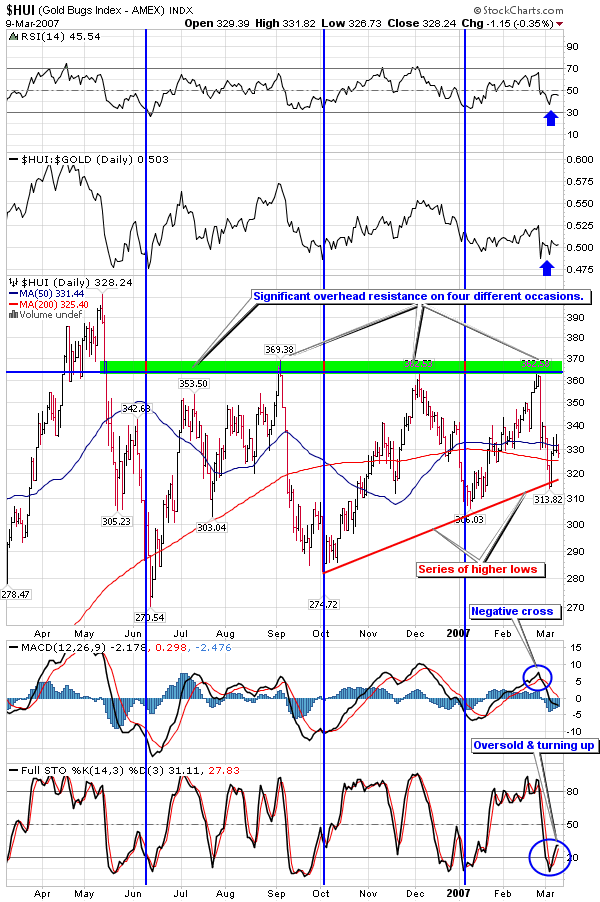
The Hui Index closed the week out up +4.95 points to 328.24 or +1.53%. It did not close at the high for the week - Thursday's, Wednesday's, and Tuesday's closing prices were higher. The intra-week high was 336.15 made on Thursday.
This price action shows that overhead supply is prevalent, and that rallies are being sold into. Shares are moving from weak to stronger hands.
The daily Hui chart below shows more strength then the Xau chart. The Hui closed up for the week, it has put in a series of higher lows, it is rising up off of oversold readings, and the only negative is that it has not bettered its Dec. 2006 high (at least not as of yet).
Higher lows are more important in sustaining a bull market. As long as higher lows are kept intact - higher highs eventually follow - until the bull turns to a bear. It's a bull market until it isn't, and as of now it is.
We have been, and will most likely continue, to incrementally add positions on weakness. See our gold portfolio where all buys and sells are:
REAL TRADES - NOT THEORETICAL WISHFUL THINKING
Hui Point & Figure
The below point and figure chart shows a bearish price objective of 268, after a low pole reversal on March 8, 2007. This is the traditional P&F chart. See the second chart below, which is a percentage P&F chart, which has a higher price objective.
Xau Point & Figure
The Xau point and figure chart also shows a bearish price objective of 110.00.
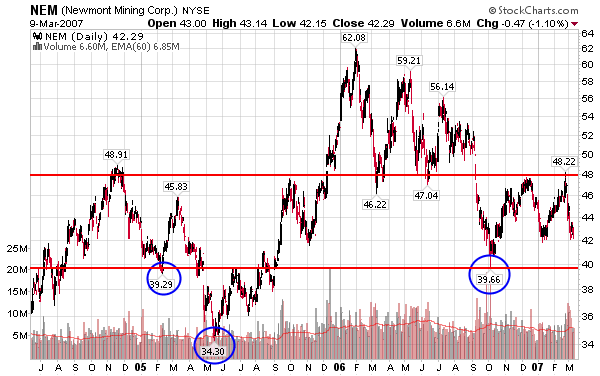
Newmont Mining
We are beginning to get interested in Newmont Mining. Newmont has been beaten up pretty good in the recent past. Prior to this it was the "King" of the gold stocks, it then fell out of favor (and with good reason).
It appears to be making a bottom, and when the next phase of the gold bull begins the Institutional Players will go to it because of its liquidity or trading volume. It is one of the few gold stocks that can handle large institutional buying.
The P&F chart shows a bullish price objective of $61.00. Presently it is trading at $42.00. We may slowly begin to accumulate on weakness between 42 - 40.
See charts below for further details.
Royal Gold
Royal Gold is another piquing our interest. Its P&F chart below shows a bullish price projective of $48.00. Presently it is trading at $31.00
We are considering slowly accumulating positions on pullbacks that make higher lows.
Yamana Gold
Yamana Gold we are watching, but with a bit more caution. We have owned it several times in the past (as well as the other stocks under review), however, it has had a pretty good run of late, and recently registered a high pole warning on March 2, 2007.
We may become more interested on pullbacks to support that makes higher lows. Time will tell. Watch our gold stock portfolio for buys.
Hecla Mining
We have owned Hecla previously and just recently sold our position to book profits. The P&F chart below shows a bullish price objective of $16.00. It presently sells for $8.17.
We are watching it, as it has been one of the strongest gold/silver stocks of late; however, it has also already had a pretty good run up.
We will consider it on pullbacks that hold above support and make higher lows.
Summary
The stock market appears to have stopped falling and may be constructing a short term bottom. Most of the sentiment indicators are flashing oversold and pessimism abounds.
Call to put ratios are very high, as well as downside versus upside shares. Lowry's figures hint at a short term rally. From an intermediate and longer term view a bear market may be about to resume this summer to fall.
The carry trades with the yen and Swiss franc are back in vogue. The world has returned to its comfortable position of asset bubbles and derivative extremes in paper fiat land.
The bond market is starting to show higher rates. Will they continue or is this just a blip to the upside? If they continue up real estate will take a much larger hit then it is already experiencing. Sub-prime lenders problems are spreading to others. The process is going to get worse before it gets better.
Commodity prices are varied - some are up and some are now, however, the CCI Index gives a much clear view of the overall commodity market, which does not look bad at all. Energy has rallied but still remains in a downtrend.
Gold & silver took a hit along with the other markets in the carry trade debacle. They have since recovered some but still remain subdued. Sentiment indicators show pessimism, as rallies are sold into and product moves from weak to strong hands. The indicators were more negative then positive and hint that further downside action could occur.
The Hui Index is in better shape then the Xau Index. The indicators show a mixed bag - some are positive, while others are negative. Sentiment indicators are mostly positive; suggesting that a move up may soon follow. We are slowly accumulating selective shares on weakness.
A number of individual precious metals stocks were reviewed as possible buy candidates. Old time favorite Newmont Mining, which has recently fallen from grace, now looks like it may be coming back to life. We may slowly begin to accumulate minor positions.
Royal Gold, Hecla, and Yamana are also on our watch list.
Invitation
Stop by our website and check out the complete market wrap, which covers most major markets. There is also a lot of information on gold and silver, not only from an investment point of view, but also from its position as being the mandated monetary system of our Constitution - Silver and Gold Coins as in Honest Weights and Measures.
There is also a live bulletin board where you can discuss the markets with people from around the world and many other resources too numerous to list. Drop by and check it out. Good luck. Good trading. Good health. And that's a wrap.
By Douglas V. Gnazzo
Honest Money Gold & Silver Report
Douglas V. Gnazzo is the retired CEO of New England Renovation LLC, a historical restoration contractor that specialized in the restoration of older buildings and vintage historic landmarks. Mr. Gnazzo writes for numerous websites, and his work appears both here and abroad. Just recently, he was honored by being chosen as a Foundation Scholar for the Foundation of Monetary Education (FAME).
Disclaimer: The contents of this article represent the opinions of Douglas V. Gnazzo. Nothing contained herein is intended as investment advice or recommendations for specific investment decisions, and you should not rely on it as such. Douglas V. Gnazzo is not a registered investment advisor. Information and analysis above are derived from sources and using methods believed to be reliable, but Douglas. V. Gnazzo cannot accept responsibility for any trading losses you may incur as a result of your reliance on this analysis and will not be held liable for the consequence of reliance upon any opinion or statement contained herein or any omission. Individuals should consult with their broker and personal financial advisors before engaging in any trading activities. Do your own due diligence regarding personal investment decisions. This article may contain information that is confidential and/or protected by law. The purpose of this article is intended to be used as an educational discussion of the issues involved. Douglas V. Gnazzo is not a lawyer or a legal scholar. Information and analysis derived from the quoted sources are believed to be reliable and are offered in good faith. Only a highly trained and certified and registered legal professional should be regarded as an authority on the issues involved; and all those seeking such an authoritative opinion should do their own due diligence and seek out the advice of a legal professional. Lastly, Douglas V. Gnazzo believes that The United States of America is the greatest country on Earth, but that it can yet become greater. This article is written to help facilitate that greater becoming. God Bless America.
© 2005-2022 http://www.MarketOracle.co.uk - The Market Oracle is a FREE Daily Financial Markets Analysis & Forecasting online publication.