


GOLD: Will Summer 2015 Rally Mark A Cyclical Turning Point?
Commodities / Gold and Silver 2015 Jun 21, 2015 - 04:02 PM GMTBy: GoldSilverWorlds

 It was another volatile week in the markets. The interest rate decision by the U.S. Fed on Wednesday was a non-event with no change in the Fed’s monetary policy. The market reacted with a spike in stocks, bonds, and precious metals, while the U.S. dollar took a dive. Also, the unfolding drama in Greece spooked markets and metals; stock markets are nervous while metals mostly get bids each time the Greek crisis flares up.
We focus on gold’s seasonality in this column and what it could mean for gold’s secular trend.
Between 1982 and 2012, gold typically started rising in early July, corrected slightly in October, and finished the year strongly higher. The first chart, courtesy of our friend, author, and market analyst Dimitri Speck, shows that the second week of June typically kicked off the yearly rise with a final dip.
Courtesy: Seasonal Charts
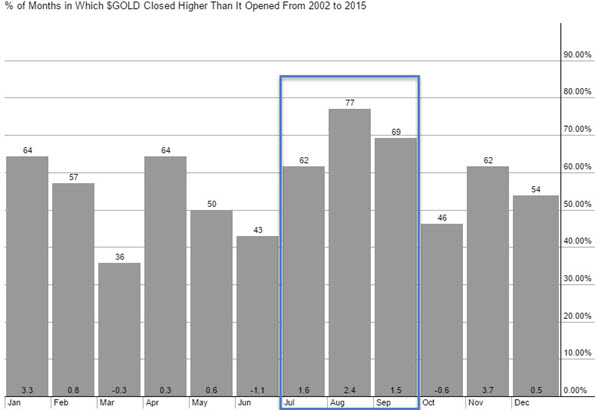
Included within that 30 year time frame was a secular bear market (until 2001) and a secular bull market (as of 2002). We look more closely at gold’s seasonality since the secular bull market started in 2002. The second chart, courtesy of StockCharts, shows the number of months in which gold closed higher than it opened. Clearly, July through September stand out with the largest number of higher monthly closes, while October is one of the weakest months in the year.
The same seasonality picture for the period between 1990 and 2000, the last decade of gold’s secular bear market, shows a random picture of up and down months, without a consistent rise during the summer months. We assume that is typical behavior during a weak market.
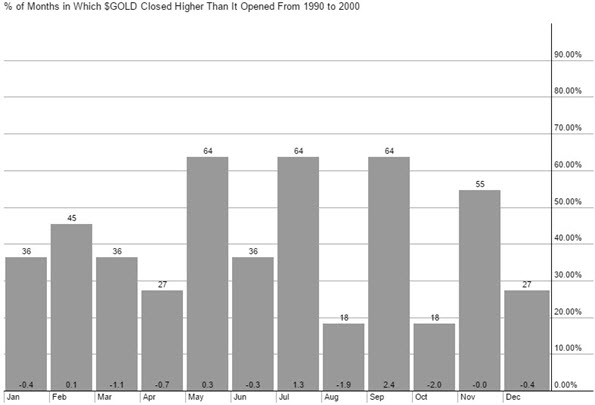
We conclude that gold bulls want a strong summer which will confirm that the gold secular bull market is still intact.
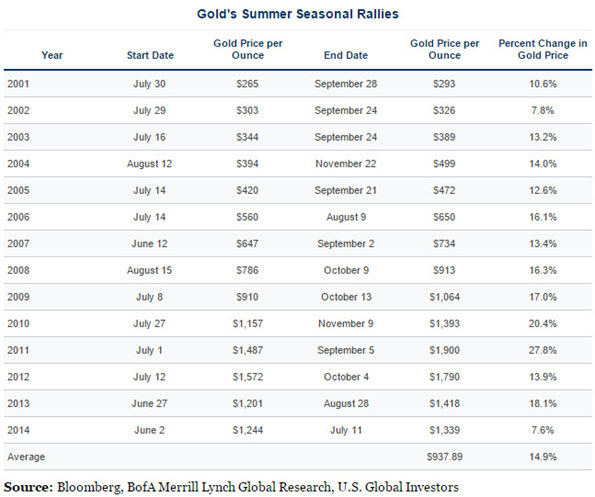
Looking one level deeper into the summer rallies in the current secular bull, we found some interesting insights. The table below shows the exact period in which gold had a summer rally, along with the % price rise in USD. Interestingly, we see that gold started to rally between June and mid-July in 8 out of the last 10 years. Over that same period, the average price rise during those rallies was 16.3%.
What does this mean in the context of the current cyclical bear market within gold’s secular bull? To answer that question we rely on the long term trendlines on the weekly and monthly charts. The trendline on the weekly is marked in red.
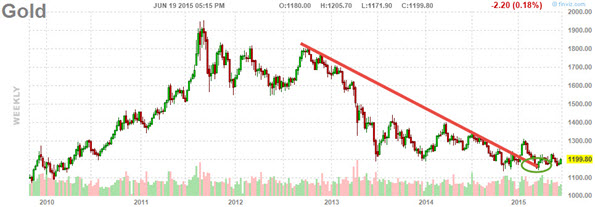
The general rule is that the significance of a trendline increases substantially with every touchpoint. The red trendline on the weekly chart has the highest number of touchpoints. We believe that gold broke out mid-March of this year, as indicated with the green oval. One could argue that the breakout went unnoticed, as few have spoken about this “event,” concluding that it was unimportant. Our view is the opposite. Because it went unnoticed during a cyclical correction (bear market), it increases the odds that it was THE important event. That is how bear markets end, and especially when nobody talks about it.
This summer’s seasonality is quite important. If gold’s summer rally is strong, we will conclude two things. First, we will have a confirmation of the seasonal trend during the secular bull market, increasing the probability that the secular bull is still intact. Second, the probability increases that the breakout point already occurred in March.
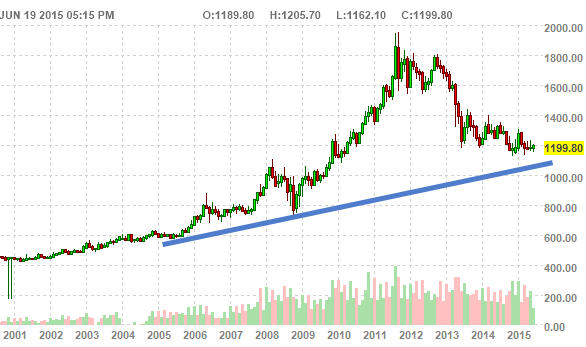
However, even if the summer rally does not occur and we see a continuation of the sideways pattern, there is still evidence that gold remains in a secular bull market. The next chart shows that the secular trendline marked in blue will touch the $1200 price level in about a year. That means gold can trade sideways for a year without invalidating its secular bull trend.
Smart investors do not anticipate a particular move, they prepare themselves for what is likely to happen. A breakout in gold and silver is a high probability move. That is why we recommend an investing roadmap based on the very best gold and silver plays.
It is our duty to select those investments in the Gold & Silver Report!
Secular Investor offers a fresh look at investing. We analyze long lasting cycles, coupled with a collection of strategic investments and concrete tips for different types of assets. The methods and strategies are transformed into the Gold & Silver Report and the Commodity Report.
Follow us on Facebook ;@SecularInvestor [NEW] and Twitter ;@SecularInvest
Source - http://goldsilverworlds.com/
© 2015 Copyright goldsilverworlds - All Rights Reserved Disclaimer: The above is a matter of opinion provided for general information purposes only and is not intended as investment advice. Information and analysis above are derived from sources and utilising methods believed to be reliable, but we cannot accept responsibility for any losses you may incur as a result of this analysis. Individuals should consult with their personal financial advisors.
© 2005-2022 http://www.MarketOracle.co.uk - The Market Oracle is a FREE Daily Financial Markets Analysis & Forecasting online publication.