Brent Crude Oil Price Breaks out of Bearish Wedge
Commodities / Crude Oil Jul 07, 2015 - 01:21 PM GMTBy: MarketsToday
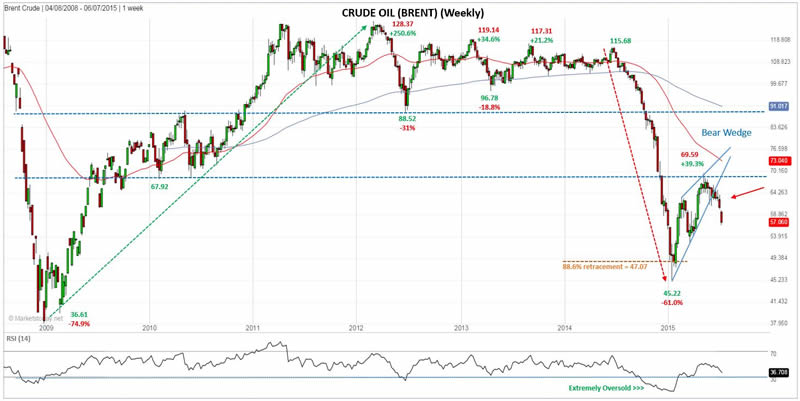
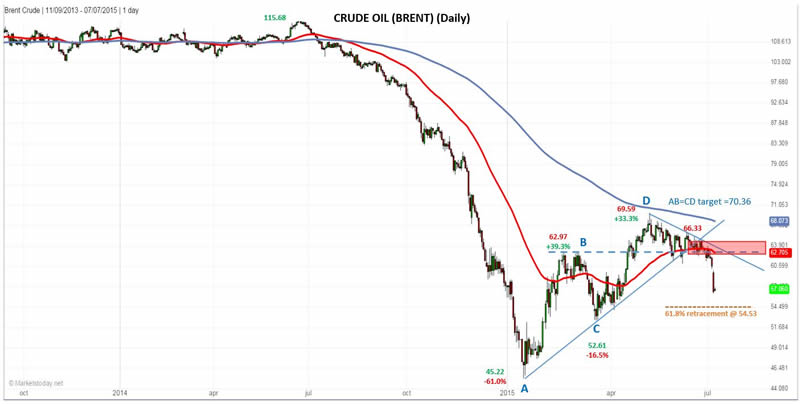
Brent Crude broke down from a bearish rising wedge formation several weeks ago, trading relatively sideways thereafter, until the tail end of last week when it fell below and closed below $60.97. The 50% retracement at $57.41 was surpassed yesterday to the downside, with the next target being around the 61.8% Fibonacci retracement level at $54.53, followed by the most recent swing low (C) at $52.61.

There’s only been one leg down since the bearish breakout so rallies up into resistance can be used to get out of long positions or enter new shorts. Resistance could be found around the short-term downtrend line (see Daily chart), followed by around $62.71/62.97, consisting of the 55-day exponential moving average (ema) and a previous peak, respectively. Those price areas then start a potential resistance zone up to approximately 66.33, consisting of a prior consolidation phase.
A rally above $66.33 could change the outlook to bullish, depending on how Brent arrived at that price level.

On May 6th, Brent peaked at $69.59, just 1% shy of completing a perfect AB=CD pattern, and just under resistance of the 200-day ema. This combined with the breakout of the bearish wedge points to the possibility that the rally in Brent has come to an end. The wedge breakout is a classic trend continuation pattern and so far it is signaling that the downtrend that started a little over a year ago will continue. Watch the level of strength in the next rally for signs of what’s to come.
Based on the wedge pattern alone, the target from the breakout is the beginning of the pattern at 45.22.
By Bruce Powers, CMT
About MarketsToday.net: MarketsToday.net® is an online financial portal covering the Middle East stock markets, plus spot Forex, oil, and precious metals, published in both Arabic and English. It is designed to help keep investors and traders up-to-date with the latest news, quotes, performance trends, and market developments in the Middle East stock markets.
Copyright 2015 © MarketsToday - All Rights Reserved
Disclaimer: The above is a matter of opinion provided for general information purposes only and is not intended as investment advice. Information and analysis above are derived from sources and utilising methods believed to be reliable, but we cannot accept responsibility for any losses you may incur as a result of this analysis. Individuals should consult with their personal financial advisors.
© 2005-2022 http://www.MarketOracle.co.uk - The Market Oracle is a FREE Daily Financial Markets Analysis & Forecasting online publication.


