


USDJPY Correction Underway
Currencies / Japanese Yen Jul 10, 2015 - 08:13 AM GMTBy: Austin_Galt

 The USDJPY currency pair has traded exactly as laid out in previous client analysis and a correction now appears underway. Let's analyse both the medium term and long term pictures using the weekly and yearly charts.
USDJPY Weekly Chart
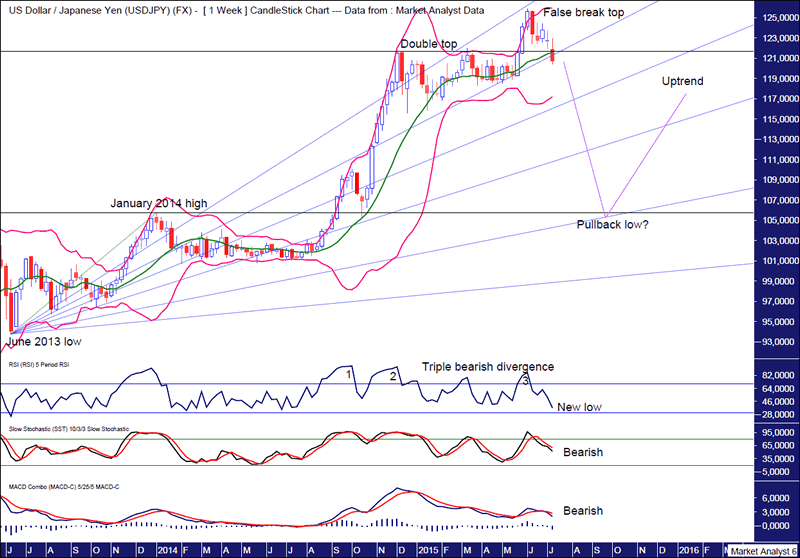
The upper horizontal line denotes a previous double top. This was against the trend which made it unlikely to be the end to the bull trend as double tops rarely are. Price subsequently traded above that level putting a high at 125.85 before turning back down. This has set up a false break top which is a common topping pattern.
I have drawn a Fibonacci Fan from the June 2013 low to January 2014 high and we were looking for the high to be at resistance from the 38.2% angle. Bingo. Price now looks set to crack below this angle with the next support zone being at the 50% angle.
At this stage, my target for pullback low is around support from the 76.4% angle. Why?
The lower horizontal line denotes the January 2014 high at 105.73. Old tops often provide support in the future and this is where I favour the low to be. Perhaps price nudges a bit lower as it gives this support level a good test.
Also, we can see the move higher above this level was parabolic in nature. When correcting, price often returns to these exact areas. This support zone looks to intersect with the 76.4% Fibonacci Fan angle in September 2015.
The RSI showed a triple bearish divergence at the recent high which often leads to a significant decline which we appear to be witnessing now. This indicator is now making a new low which is bearish as the final low is likely to be accompanied by at leats one bullish divergence.
Both the Stochastic and MACD indicators are both trending down indicating the likelihood of lower prices going forward.
Let's now check out the big picture with the yearly chart.
USDJPY Yearly Chart
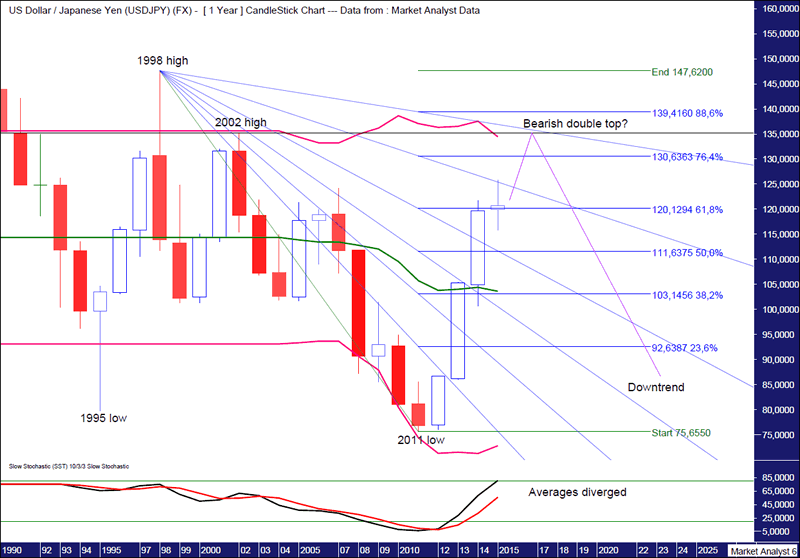
We can see clearly that a massive bear market is in play with a pattern of lower lows and lower highs. The 1998 high at 147.62 was a lower high which followed a lower low set in 1995. Price subsequently traded even lower putting in a lower low in 2011 at 75.65.
Price is now rallying and my favoured scenario is for price to put in the next lower high around resistance given from the 2002 high at 135.16 which is denoted by the horizontal line. This would set up a bearish double top and considering this is the yearly chart you can multiply that bearishness umpteen times.
I have added Bollinger Bands and my target for high is back up at the upper band.
I have added Fibonacci retracement levels of the move down from 1998 high to 2011 low and my target for high lies above the 76.4% level at 130.63 and below the 88.6% level at 139.41.
I have drawn a Fibonacci Fan which shows price currently at resistance from the 76.4% angle while I favour the final high to be at resistance from the 88.6% level. This angle looks set to intersect with my high target levels in late 2016 and early 2017.
Also, the Stochastic indicator shows the averages have diverged greatly. This generally means time is ticking on current trend. It is still bullish however so we should expect higher prices.
Summing up, a big correction looms over the medium term before price rises to new highs once again. The longer term picture suggests some further upside before the overall bear trend reasserts its control with devastating consequences in the years to come.
By Austin Galt
Austin Galt is The Voodoo Analyst. I have studied charts for over 20 years and am currently a private trader. Several years ago I worked as a licensed advisor with a well known Australian stock broker. While there was an abundance of fundamental analysts, there seemed to be a dearth of technical analysts. My aim here is to provide my view of technical analysis that is both intriguing and misunderstood by many. I like to refer to it as the black magic of stock market analysis.
Email - info@thevoodooanalyst.com
© 2015 Copyright The Voodoo Analyst - All Rights Reserved
Disclaimer: The above is a matter of opinion provided for general information purposes only and is not intended as investment advice. Information and analysis above are derived from sources and utilising methods believed to be reliable, but we cannot accept responsibility for any losses you may incur as a result of this analysis. Individuals should consult with their personal financial advisors.
Austin Galt Archive |
© 2005-2022 http://www.MarketOracle.co.uk - The Market Oracle is a FREE Daily Financial Markets Analysis & Forecasting online publication.