


Gold BREAKOUT!
Commodities / Gold & Silver Jun 20, 2008 - 11:53 AM GMTBy: Peter_Degraaf

 Gold is breaking out on the upside today, after having been contained in a bullish pennant formation for the past 93 days. This 93 day period satisfies the time element, (referring to the average of the late spring – early summer pull-backs in gold), since the current bull market began, in 2001.
Virtually every year we witness a Christmas rally in gold, with the seasonal lows coming in the spring, following a correction towards the 200DMA.
Here are the months during which these seasonal lows have occurred since 2001
- 2001 in April
- 2002 in February
- 2003 in April
- 2004 in May
- 2005 in May
- 2006 in June
- 2007 in June
- 2008 on May 2 nd , with a secondary (higher) low on June 12 th .
- Every year since 2001, once this seasonal low was in place, the market rose higher during the remainder of the year, culminating in the annual Christmas rally.
An upside breakout, such as the one we are witnessing today (Friday June 20 th ), will confirm this secondary bottom and will attract a lot of traders who are currently on the sidelines, to commit funds to the gold sector.
Charts courtesy www.stockcharts.com
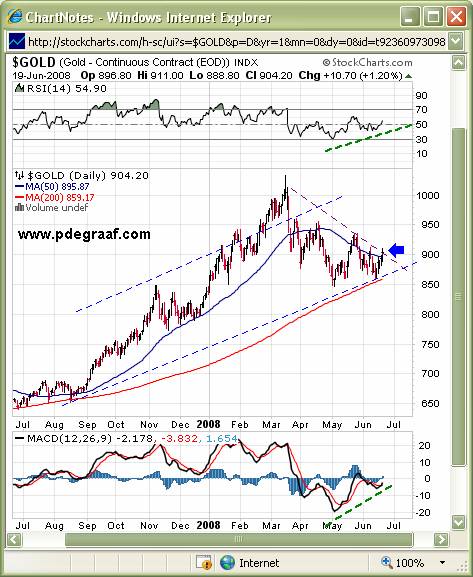
Featured is the daily gold chart. Price is breaking out from beneath the downsloping resistance line today (blue arrow). Price tested the support at the 200DMA last week, and the support held. According to market expert Joseph Granville: “In a bull market, when the 200DMA is rising, each time ‘price' visits the 200DMA, it represents a buying opportunity.”
One reliable sign of a bull market is when the 50DMA is in positive alignment to the 200DMA, while the 200D is rising, (as now).
The supporting indicators are positive (green lines). The target for this breakout is a test of the previous high at $1,030.00.
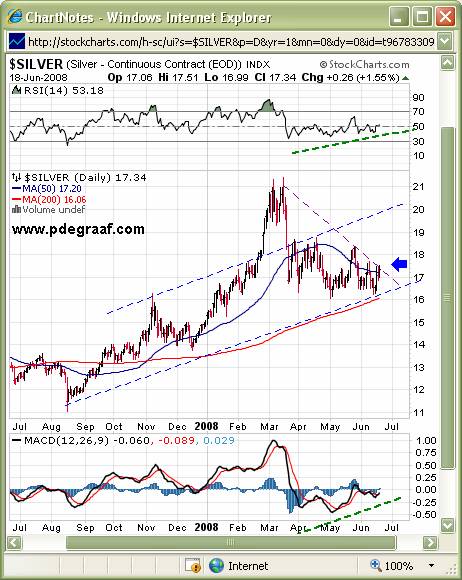
Featured is the daily silver bar chart. Price is breaking out from beneath the four month old downtrend line today, after a successful test of the support at the 200DMA last week. The 50DMA is in positive alignment to the 200DMA, and the 50D is flattening in preparation for the next rising trend. The supporting indicators are positive (green lines). The target for this breakout is the previous top at 21.00.
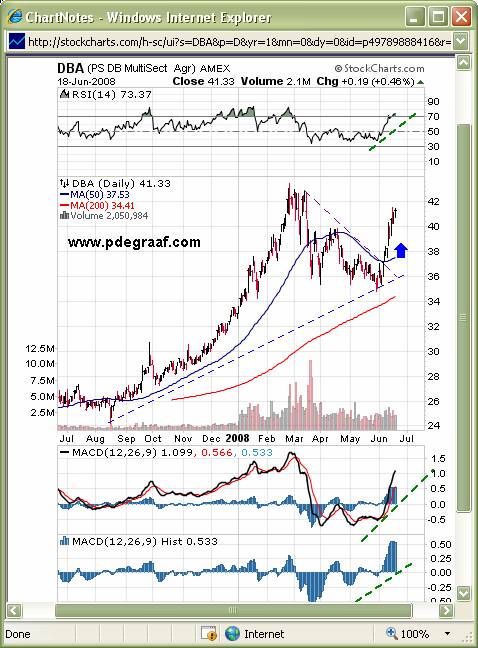
Featured is the DBA agri ETF. In the weekend report I sent out to my subscribers last Friday I showed this chart and pointed out that this was likely a precursor for similar action to be expected in gold this week.
======================================================
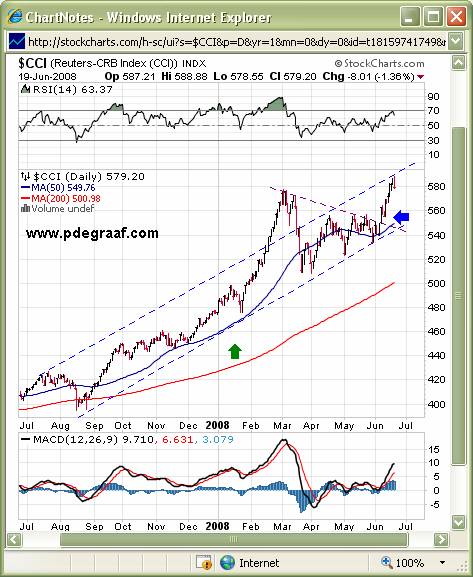
Featured is the CCI commodity index. In the ‘early bird edition' of the Premium Service E-mail that went out to subscribers Tuesday evening I showed this breakout (blue arrow), and suggested that we would likely see a similar breakout in gold this week. This is a very bullish chart. The 50D is in positive alignment to the 200D (green arrow), and both are rising. While the index is likely due for a slight pull-back just now, the overall uptrend is well defined (blue lines).
===============================================================
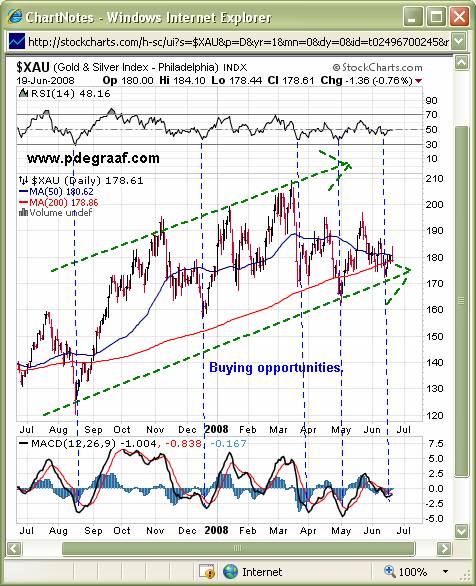
Featured is the XAU gold and silver stocks index. The uptrend is well defined within the green arrows. The 200DMA has been rising all year. The blue vertical lines represent buying opportunities. A close above 185 will indicate an upside breakout from beneath the four month old downtrend. It could happen today! =====================================================
Chart courtesy Federal Reserve Bank of St. Louis
Featured is the chart that depicts the ‘official real interest rates'(T-bills less CPI). This rate, as reported by the Feds is -2%. The actual ‘real interest rates' are even more negative. Bill Gross, (the ‘bond king') estimates worldwide price inflation to be at 7%. This puts ‘real interest rates' at -5%, instead of the -2% reported by the Federal Reserve. Suffice it to say that when ‘real rates' are negative, gold always rises. It's a given! You can bank on it! (And that is more than you can say for some banks).
Summary:
Gold and silver are in the process of breaking out. Don't be left behind! Already we have seen breakouts in the CCI, the CRB, DBA, Palladium, Copper and Natgas. South African gold production for April dropped 10% below April 2007. Since 1998 SA production has been cut in half! Gold mines are running out of gold, and very few worthwhile discoveries are being reported. Meanwhile the monetary spigots are working overtime to keep the banking sector from imploding.
The US dollar may appear to be stabilizing, but Fed Chairman Bernanke is caught between a rock and a hard place. He cannot very well raise interest rates to support the dollar, because of the turmoil in the banking sector (they need cheap money to survive the crisis), and the weak housing market. Bloomberg reported this week that U.S. housing starts are at the lowest level in 17 years. The Royal Bank of Scotland has warned that the worst of the banking crisis is yet to come. Meanwhile the ECB is indicating that it might raise short term rates in Euroland soon.
Note: Those of you who are suffering with low-priced juniors, might like to visit www.jsmineset.com James Sinclair is organizing a grassroots effort to fight the naked short selling that has depressed the junior miners for the past few years. He calls it: “The day the juniors fight back.” Here is a chance for all of us to do something about the problem of short-selling among the juniors.
By Peter Degraaf.
Peter Degraaf is an on-line stock trader, with over 50 years of investing experience. He issues a weekly alert to his subscribers. For a 60 day free trial, send him an E-mail itiswell@cogeco.net , or visit his website www.pdegraaf.com
DISCLAIMER: Please do your own due diligence. I am NOT responsible for your trading decisions.
Peter Degraaf Archive |
© 2005-2022 http://www.MarketOracle.co.uk - The Market Oracle is a FREE Daily Financial Markets Analysis & Forecasting online publication.