


The Historical DOW Stock Index
Stock-Markets / Stock Markets 2015 Jul 19, 2015 - 07:51 PM GMTBy: Tony_Caldaro

 Some are concerned that the stock market is overvalued, and the bull market may end soon with a resounding crash. They have some valid points. US GDP, to date, has underperformed most modern recoveries. Corporate revenues have been soft lately due to the USD’s bull market. Interest rates are at historical lows and can only go higher, eventually. Record corporate stock buy backs have been helping to drive the stock market higher. Nearly everywhere you look Central Bankers are increasing their balance sheets by buying debt, and stocks in some cases. And, there are bubbles forming in the Bond market, Biotech, and Social media sectors.
The solution, it appears, to fill the void created by the private sector’s failure to service its debt during 2008, was to create more public debt. Which the FED, in the US, promptly bought as it increased its balance sheet. During the past few years corporations started using the bond market to finance their stock buy backs. This increase in debt, both public and corporate, has many concerned. Can the solution to a debt crisis be creating more debt? A strategy that certainly does not work in the private sector.
When we look back at the 130 year documented history of the US stock market, we can quantify each and every bull and bear market using OEW. Most of them only lasted a few years. Each of them had their own fundamental problems. Some of the problems proved to be correct, others took longer to unfold than most expected at the time, and many, in the end, did not matter. Throughout this long history there have only been five bull markets to last 5 calendar years or longer. Two lasted five years, 1932-1937 and 2002-2007. One lasted eight years: 1921-1929, and another lasted thirteen years 1987-2000. Notice 5, 8 and 13 years are all Fibonacci numbers. The fifth, of these lengthy bull markets, is currently underway. In calendar years it is in its sixth year, (2009-2015), in months its seventh year (76 months). In fact, as you can tell, it is the third longest bull market in the entire history of the US stock market.
Reviewing the four longest completed bull markets we find three of them had a price relationship to each other. During 1932-1937 the bull market rose about 4.75 times its value from the 1932 low. During 1921-1929 the bull market rose about 6.00 times its value from the 1921 low. And, during 1987-2000 the bull market rose about 7.25 times its value from the 1987 low. Notice the increment of rise increased by 1.25, or 125%, as the bull market stretched in years. The bull market we dropped from this comparison, 2002-2007, rose about 1.95 times its value from the 2002 low. Since the current bull market exceeded that level within its first two years, that bull market does not fit into this study.
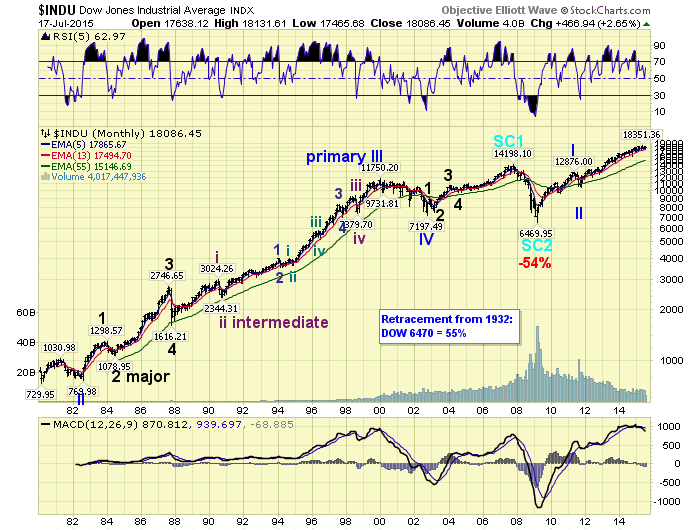
When we review the internal wave structure of the three bull markets that are comparable, we find that two of them, 1921-1929 and 1932-1937, had short first and third waves then an extended fifth wave. Since this bull market has clearly had a short first wave, 2009-2011, and an extended third wave, 2011-2015 so far, it does not look anything like those two bull markets. It actually looks more like the 1987-2000 bull market above: its first, third and fifth waves were 3, 8, and 2 years respectively.
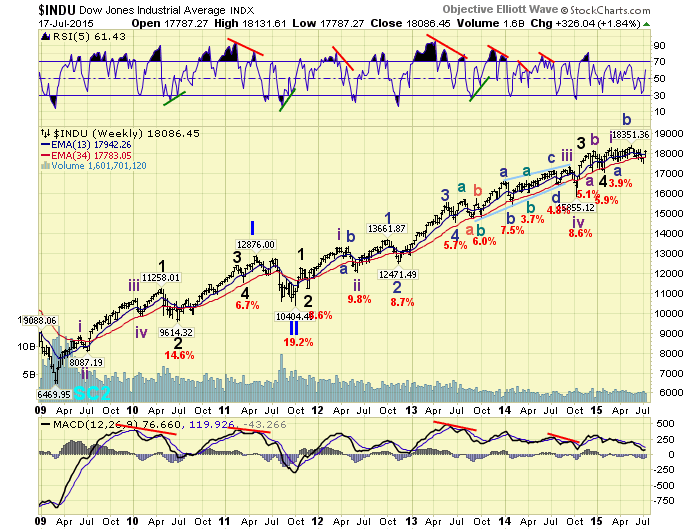
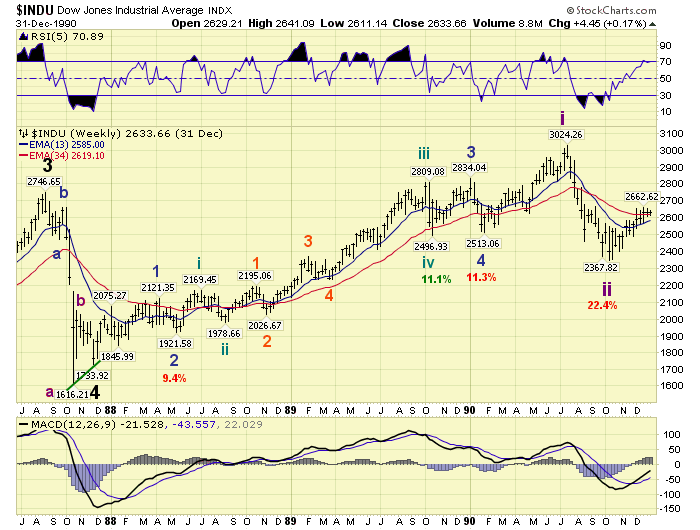
During that thirteen year bull market the first wave lasted three years, 1987-1990, and the DOW increased 87% from its 1987 low (see chart below). Then after about a 20% correction in 1990 for the second wave, the long extended third wave was underway. During this bull market the first wave lasted two years, 2009-2011, and the DOW increased 99% from its 2009 low (see chart above). Then after about a 20% correction in 2011 for the second wave, a long extended third wave has been underway. Notice, up to that point, the current bull market has been outperforming the 1987-2000 bull market in price and time. Currently the third wave is in its fourth calendar year, 2011-2015, which has five months to go. From the 2011 low the DOW has gained 76%, despite its choppy activity since 2014.
Four years into the third wave of the comparable 1987-2000 bull market the DOW had gained 71% from its 1990 low (see below). Again the current bull market is outperforming the 1987-2000 bull market in price and time.
When we review the internal wave structure of each of the three rising waves during the 1987-2000 bull market, we currently see some comparisons as well. The first wave up took three years, rose 87%, and was a very clean five wave structure. The current bull market’s first wave took only two years, rose 99%, and was a clean five wave structure as well.
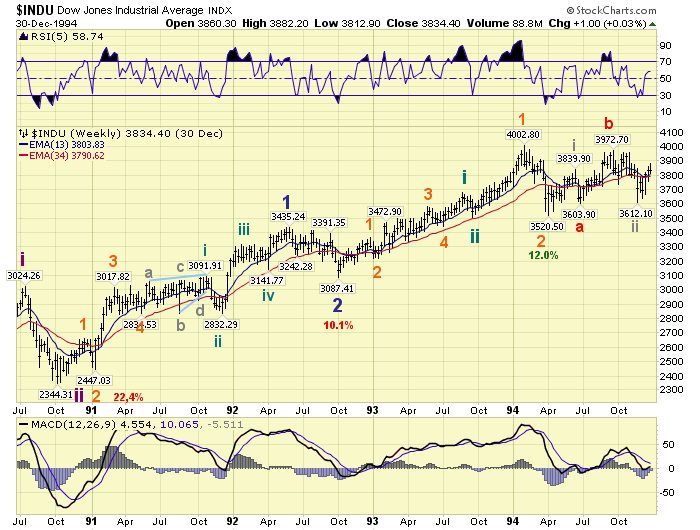
Then over the next four years, from the 1990 low, that bull market rose 71% and became quite choppy. The current bull market’s third wave is in its fourth year, has risen 76%, and is also quite choppy.
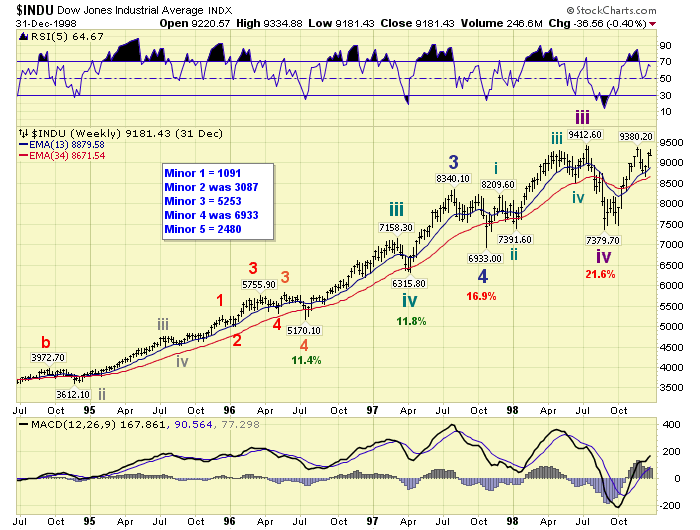
After 1994 concluded, during the 1987-2000 bull market, the subdivisions that occurred from 1990-1994, set the stage for the explosive uptrends into that 1998 third wave high. Interesting, right? Makes one wonder what is in store for this bull market.
One last comparison before we try to draw some conclusions. Seven calendar years into the 1987-2000 bull market the DOW had gained 148% from its 1987 low. Six calendar years into the current bull market the DOW has gained 184% from its 2009 low, with five months still to go. The current bull market is outperforming that bull market in time and price on every comparison.
Despite some negative fundamentals, and a near tripling in price over the past six years, this market is displaying price/time characteristics relative, or better, than some of the best bull markets in US history. It is already the third longest bull market in history, and should at least match the second longest which is eight years. It continues to outperform, in price and time, the 13 year longest and most explosive, +625%, bull market in history.
Before we jump to any conclusions there are two lower price levels to consider. And if either is achieved, it would still have been a spectacular bull market. These two levels were noted in paragraph four: a 375% gain (+4.75 from the low) and a 500% gain (+6.00 from the low). The first level equates to DOW 30,500, and the second DOW 38,600.
But let’s get conservative. The price gain relationship of the three best bull markets in history are: 4.75, 6.00 and 7.25 from their respective lows; or +375%, +500% and +625%. Since there is an increment of 1.25, let’s notch it down one level to 3.50 for this bull market. This suggests the DOW could gain 250%, or hit a level of 22,600 before the bull market ends. This gives us three potential levels going forward: 22,600, 30,500 and 38,600.
We offer this historical analysis not as a projection as to how high this bull market will go. We offer it to display the possibilities suggested by historical bull markets similar to the current one. Very few, I would imagine, expected the 1920’s bull market to reach the heights that it did at that time. Hardly anyone expected the 1990’s bull market to be the strongest and longest bull market in history. Many were calling for a top every time that bull market paused. Just like today.
Looking ahead we see this bull market probably lasting until at least 2017. Fibonacci number bull markets have occurred every time in the past. Although the sample is small. As for price. We currently have an SPX projection of 2500+ by 2016. This equates to about DOW 21,400+ using the current DOW/SPX price ratio. This is not too far from the most conservative level of DOW 22,600. But still a long way from the minimum historical DOW 30,500 level. However, if it does hit that historical minimum level, or even higher, before this bull market ends, it would not be anything that has not already occurred before. The next few years could prove to be quite interesting. Let’s see what unfolds.
CHARTS: http://stockcharts.com/public/1269446/tenpp
After about 40 years of investing in the markets one learns that the markets are constantly changing, not only in price, but in what drives the markets. In the 1960s, the Nifty Fifty were the leaders of the stock market. In the 1970s, stock selection using Technical Analysis was important, as the market stayed with a trading range for the entire decade. In the 1980s, the market finally broke out of it doldrums, as the DOW broke through 1100 in 1982, and launched the greatest bull market on record.
Sharing is an important aspect of a life. Over 100 people have joined our group, from all walks of life, covering twenty three countries across the globe. It's been the most fun I have ever had in the market. Sharing uncommon knowledge, with investors. In hope of aiding them in finding their financial independence.
Copyright © 2015 Tony Caldaro - All Rights Reserved Disclaimer: The above is a matter of opinion provided for general information purposes only and is not intended as investment advice. Information and analysis above are derived from sources and utilising methods believed to be reliable, but we cannot accept responsibility for any losses you may incur as a result of this analysis. Individuals should consult with their personal financial advisors.
Tony Caldaro Archive |
© 2005-2022 http://www.MarketOracle.co.uk - The Market Oracle is a FREE Daily Financial Markets Analysis & Forecasting online publication.