


How to Know When the Gold Bear Market is Over
Commodities / Gold and Silver 2015 Jul 27, 2015 - 07:01 PM GMTBy: ...

MoneyMorning.com
 D.R. Barton, Jr writes: Gold’s hard-and-fast tumble below $1,100 an ounce last week means some investors may be tuning out the yellow metal or suffering from gold “burnout.”
But ignoring it is a huge mistake. It has been and always will be one of the best stores of value, and it's a crucial hedge against economic upheaval. It's a must-have holding.
Last Monday's "bear raid" in Shanghai brought gold down to 13-year lows before settling at five-and-a-half year lows, and it's absolutely vital that we know when this downward pressure will stop so that we don't "call a bottom" too quickly.
You see, we can buy gold all the way down, but these charts will help us see when it will resume its upward march…
The Lightning-Fast "Bear Raid" That Brought Down Gold
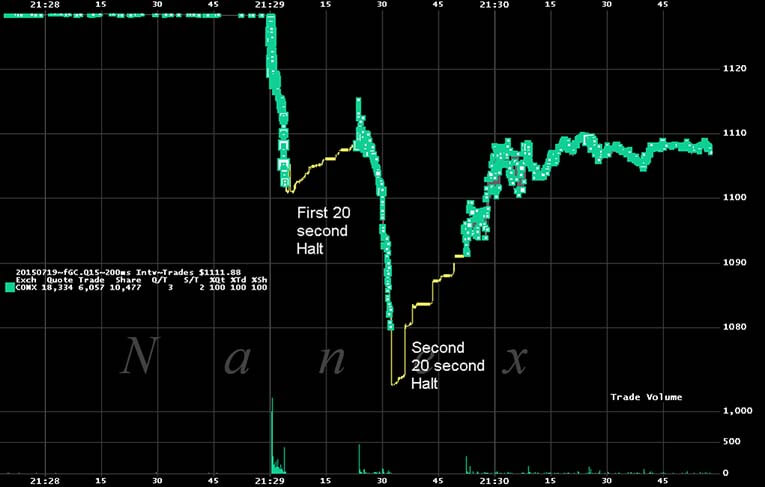
The timescales here are very short, with events unfolding by the second.
You see, around 30 seconds before the markets opened in Shanghai on Monday, July 20, at 9:30 a.m. local time (CST), gold fell $30 an ounce in a matter of four seconds, after which trading on the New York Comex exchange was halted for 20 seconds. It then plummeted another $40 before it was temporarily halted again.
By the second re-opening, trading retuned to something resembling "normal," but the (considerable) damage had already been done.
Here's a great chart from the researchers at Nanex that shows the action. Note that each horizontal line represents just 15 seconds of trading:
From this point on over the next several days, a veritable barrage of allegations hit the markets:
- Reuters first reported that Chinese traders and funds were taking advantage of low pre-market liquidity due to Japan's Ocean Day national holiday and the absence of the highly active Japanese traders to make a bear raid on the precious metal.
- Reuters subsequently reported that it was in a fact American entities on the New York Comex market that were responsible.
- And in an even more recent article, Reuters was back quoting traders from both New York and Hong Kong claiming that traders outside of those two market centers were behind the move.
- Due to the anonymous nature of futures trading, it's likely that no one party or group of parties will ever be identified as sellers during those frantic seconds.
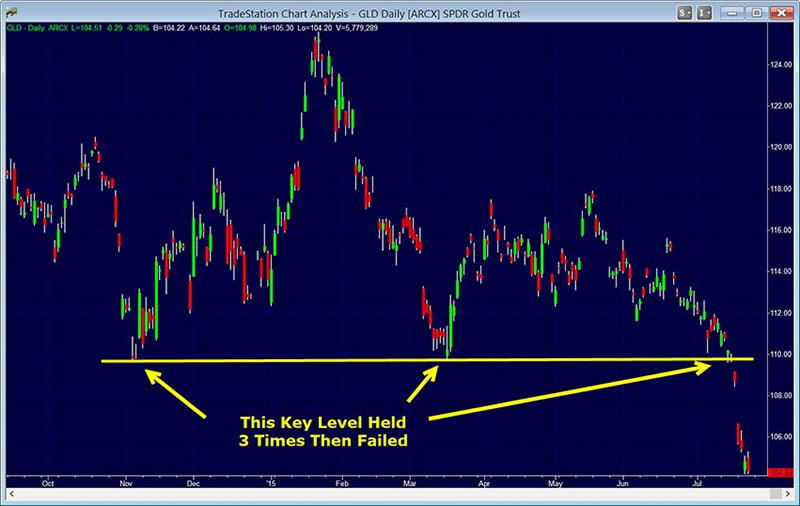
And so although we may never really know with any certainty who set off the frenzy, the undeniable truth remains that gold has slammed down through a key support area as shown on this chart:
The question on most investors' and traders' minds is, "When will gold find a bottom and start trending up again?"
Let's look at three different technical tools to help guide us toward finding levels where gold will find support.
Why These Levels Are So Important to Us
We've just broken a key intermediate-term support level, as seen in the chart above.
Technical analysts (and every trader that I know) watch support and resistance levels for two simple reasons:
First, they represent price levels where important actions happened in the past (intermediate, highs and lows, etc.).
And second, because there a lot of "eyeballs" on those key levels – analysts, traders, and institutional money managers are going to be watching these levels and making decisions based on what happens when price approaches them.
And with one important level broken in the last few days, other key levels remain just below us:
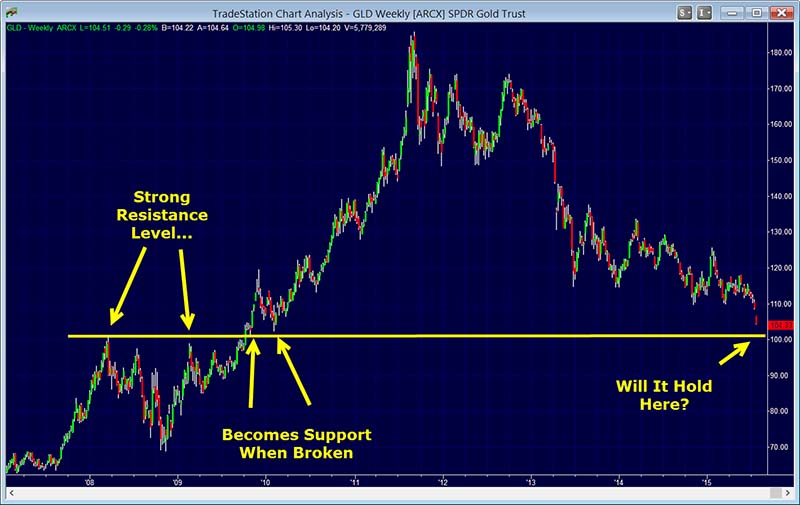
Since many people who trade or invest in gold use exchange-traded funds (ETFs), the weekly chart above shows the most active gold ETF, the SPDR Gold Trust (NYSE Arca: GLD).
The next key support level below us now for gold proved to be a strong resistance zone seven years ago.
After being broken to the upside, this price zone immediately became support and proved to be the springboard in 2010 for the great bull run up to the all-time highs.
$1,000 per Ounce Is a Crucial "Psychological" Number
Let's look at a chart from the same time period for spot gold.
A spot gold chart shows us the current cash price that physical gold is being bought and sold for on the world markets. We'll look at that same springboard level that is about 4% below current gold prices and also at the next important resistance level below that, the $1,000 price level:
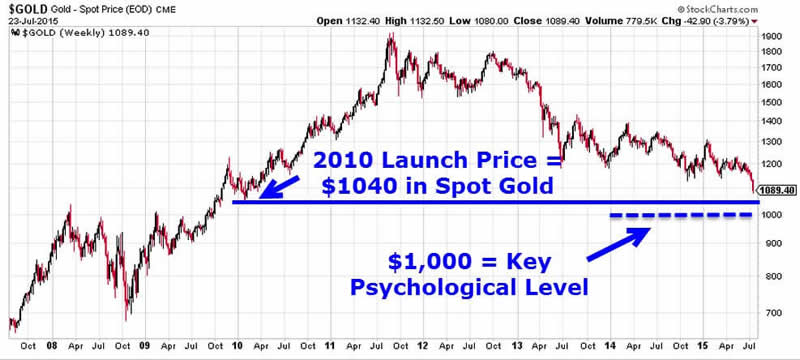
A word to the wise – don't dismiss the notion of round numbers as key zones! Many studies, including several of my own, prove definitively that round numbers are key reaction areas for financial instruments. And $1,000 per ounce is a huge one for gold.
From a technical perspective, these key levels below where gold is trading should attract price like a magnet. If either of the key levels shown in the charts above holds, they could prove to be important turning points for gold in the coming weeks and months.
Here's When We Can "Call the Bottom"
Gold has been in a five-and-a-half year bear market – and every turn up during this tumultuous time has excited the "gold bugs," only to lead to disappointment time and again.
While there will be many excellent trading opportunities in gold (especially at the potential turning points mentioned above) in the near future, trying to hop on a renewed long-term trend for a multi-year trade or investment opportunity will require some patience – and some technical guidance.
From a technical perspective, trend lines are one of the best tools to guide us in discerning when a bear market turns back into a bull.
Let's look at that SPDR gold ETF to see where the current critical trend line hits:
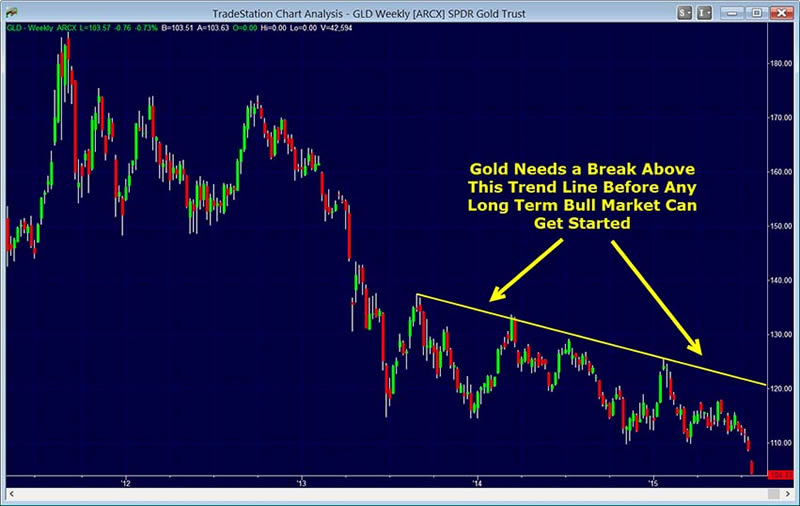
As long as price stays below this line, the gold bears rule.
Now, gold won't stay in the bear run forever; it just seems that way. Patience is required, but keeping an eye on the key technical levels described above will allow you to have a framework for navigating this market.
Here's to great trading!
Source :http://moneymorning.com/2015/07/27/how-to-know-when-golds-bearish-slide-is-over/
Money Morning/The Money Map Report
©2015 Monument Street Publishing. All Rights Reserved. Protected by copyright laws of the United States and international treaties. Any reproduction, copying, or redistribution (electronic or otherwise, including on the world wide web), of content from this website, in whole or in part, is strictly prohibited without the express written permission of Monument Street Publishing. 105 West Monument Street, Baltimore MD 21201, Email: customerservice@moneymorning.com
Disclaimer: Nothing published by Money Morning should be considered personalized investment advice. Although our employees may answer your general customer service questions, they are not licensed under securities laws to address your particular investment situation. No communication by our employees to you should be deemed as personalized investent advice. We expressly forbid our writers from having a financial interest in any security recommended to our readers. All of our employees and agents must wait 24 hours after on-line publication, or after the mailing of printed-only publication prior to following an initial recommendation. Any investments recommended by Money Morning should be made only after consulting with your investment advisor and only after reviewing the prospectus or financial statements of the company.
© 2005-2022 http://www.MarketOracle.co.uk - The Market Oracle is a FREE Daily Financial Markets Analysis & Forecasting online publication.