


U.S. Home Sales Market Is Dead – This Chart Proves It
Housing-Market / US Housing Jul 29, 2015 - 04:42 PM GMTBy: ...

MoneyMorning.com
 Lee Adler writes: The seasonally adjusted (SA) headline number for the monthly-error-times-12-annualized version of new home sales in June was 482,000.
Wall Street analysts had guessed that the number would be 550,000. The Wall Street Journal went into apoplectic excuse-making mode, almost foaming at the mouth to try to find pundits to explain away the bad number.
The whole spectacle was silly and pointless since we have actual data and can readily see whether sales remain on trend or not. We don't need Wall Street pundits to tell us what to think.
We can see for ourselves…
The Numbers Look Great… If You Have No Memory
Actual June sales were estimated by the Census Bureau to be 45,000 units, based on their small sample of builders nationally. This number and the headline number are subject to big revisions in subsequent months because the margin of error on the initial release is huge.
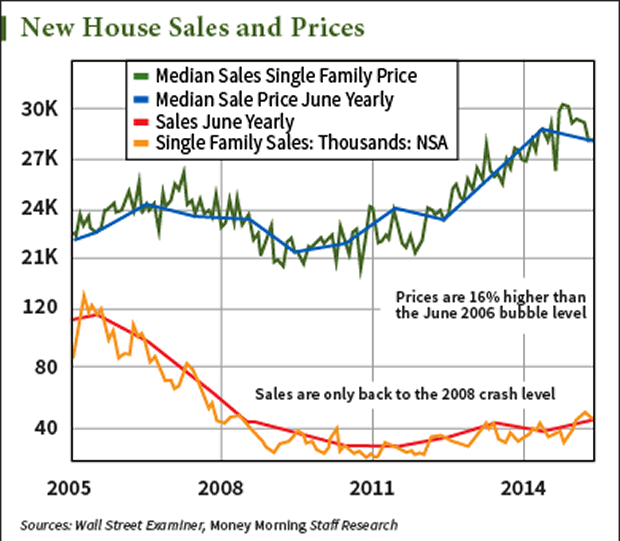
But let's assume that the 45,000 figure is in the ballpark. That number was 7,000 units, or 18.4%, higher than June of last year. 2014 was a down year, but the current figure is also 4.7% above the June 2013 peak level. So new house sales are still trending higher, at least a little bit. They are a whopping 60.7% higher than the June 2010 low in the cycle.
Sounds great, right? Consider this…
The current rate of sales is exactly the same as in June 2008, the next to last year in the housing collapse. It is 54% below the level of June 2006 and 61% below the June 2005 level (when I sold my house in Florida).
While sales haven't bounced much, the "recovery" in prices has been remarkable. If 2006 was the peak bubble year, with the median sale price in June hitting $243,200, what does that make the current median of $281,800, which is 16% higher? Not a bubble? I'll let you be the judge.
The median price is up 31% since June 2010. But of course house prices don't "inflate." Neither The Wall Street Journal, whose godfather Rupert Murdoch also owns Realtor.com, nor any of the other mainstream media press release repeaters ever use the word "inflate" or "inflation" when it comes to house prices.
We're told to think, "What we don't inflate, you must appreciate!"
The Disappointing Trend Driving This "Growth"
Prices have come down over the past year. Is the bloom off the bubble? Maybe, but the trend won't be broken until the lower channel line, now around $265,000, gives way. We'll keep an eye on that.
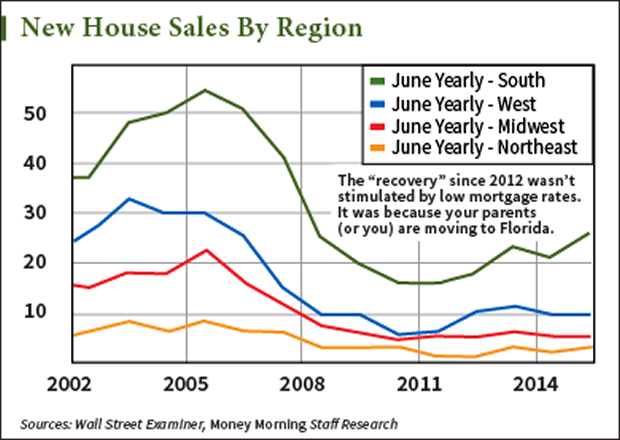
Looking under the cover of the headline number, the breakdown of the data is ugly. Virtually the entire year-to-year gain is because of your parents, and maybe you if you're my age, moving to Florida. There were 26,000 sales in the "South" (actually the Southeast). That was 5,000 units, or nearly 24%, above last June, accounting for 58% of total sales. By the same token, even with the recovery, sales in the Southeast were still down 49% from the peak of June 2005.
Other than that permanent demographic trend of retirees moving south, there is no new home sales market.
It's dead… finished… kaput.
No other region, not even the West, which had also been seeing some retirement migration, is above the 2013 level. The West and Midwest were unchanged from last year, both down a thousand units from the June 2013 "peak." The West is down 67% from the June 2005 level. The Midwest is down 73% from 10 years ago.
The Entire Housing Market Has Become an Illusion
In the Northeast, there really is no housing market. The most densely populated region of the United States, with approximately 56 million residents, had all of 3,000 new houses sold in June. That was up 1,000 from last June, but not better than the 3,000 units sold in June 2013.
The bottom line is that there's no housing recovery in the Northeast or Midwest, the West has been stalled since 2012, and the South, while rising again, is still at only half the levels reached 10 years ago. The only recovery in the single-family housing development market has been due to the demographic trend of boomers retiring. Absent that, there would be no growth, and for three-quarters of the country, there is none.
Finally, at least the Fed's zero interest-rate policy (ZIRP) is allowing working families to buy a new home, right?
Wrong.
Yes, it's helping those in the upper income strata, but not those at the median household income or below. At typical qualifying ratios, a family with the U.S. median household income of around $54,000 could afford to purchase a house costing around $200,000 with a minimal down payment.
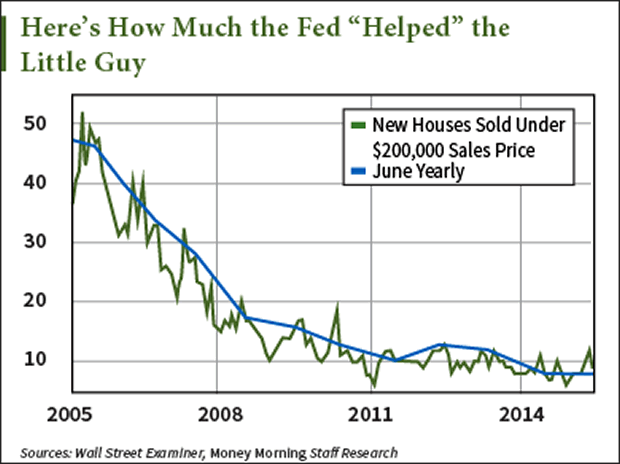
How many houses were sold at that price in June? Eight thousand – just 17.7% of total sales. That's the same amount of sales as last June, but a third less than June 2013's 12,000. It is even lower than the lowest level of the housing crash.
There are approximately 75 million U.S. households at the median income or below. Eight thousand new houses were sold at a price they could afford. That's one house for every 10,000 families. This is just more evidence that ZIRP has done nothing for most ordinary working people.
All the while, Wall Street economists and mainstream media press release repeaters show appreciation instead of approbation for the housing inflation that ZIRP has stimulated.
For most working Americans aspiring to buy a home, house price inflation has made such a goal that much harder to reach. And it has done nothing to help housing contribute to the U.S. economy.
Were it not for the demographic trend of baby boomers retiring and moving to Florida, there would be no growth in the housing market. All ZIRP has done is cause more inflation and hardship for millions of American families victimized by this immoral and ineffective policy.
Editor's Note: Lee Adler has been covering the global markets (without regard to establishment spin-meisters) for nearly 15 years over at the Wall Street Examiner. He predicted everything from the top of the dot-bomb bubble in 2000 to the Crash of 2008. We're sharing this story with you today because Lee has uncovered a critical problem with the U.S. housing market – a problem the Fed is betting we won't find out about…
Source :http://moneymorning.com/2015/07/29/the-home-sales-market-is-dead-this-chart-proves-it/
Money Morning/The Money Map Report
©2015 Monument Street Publishing. All Rights Reserved. Protected by copyright laws of the United States and international treaties. Any reproduction, copying, or redistribution (electronic or otherwise, including on the world wide web), of content from this website, in whole or in part, is strictly prohibited without the express written permission of Monument Street Publishing. 105 West Monument Street, Baltimore MD 21201, Email: customerservice@moneymorning.com
Disclaimer: Nothing published by Money Morning should be considered personalized investment advice. Although our employees may answer your general customer service questions, they are not licensed under securities laws to address your particular investment situation. No communication by our employees to you should be deemed as personalized investent advice. We expressly forbid our writers from having a financial interest in any security recommended to our readers. All of our employees and agents must wait 24 hours after on-line publication, or after the mailing of printed-only publication prior to following an initial recommendation. Any investments recommended by Money Morning should be made only after consulting with your investment advisor and only after reviewing the prospectus or financial statements of the company.
© 2005-2022 http://www.MarketOracle.co.uk - The Market Oracle is a FREE Daily Financial Markets Analysis & Forecasting online publication.