


EURUSD: An Ending Diagonal Triangle in Action
Currencies / Euro Aug 04, 2015 - 11:54 AM GMTBy: EWI

 See how beautifully recent trading in the euro followed a high-confidence Elliott wave pattern
Remember how during the time of the Greek bailout a couple of weeks ago, the euro didn't seem to "know" which way to go next? There is a reason for that, says The Wall Street Journal -- carry trade:
"The tried-and-tested carry trade involves borrowing money in a low-interest country with a weak currency, and investing where a currency's returns are higher.
"The carry trade helps to explain the euro's counter-intuitive behavior during the Greek turmoil in recent weeks. The euro fell when there looked to be progress, and gained on bad news. Why? Well, when Greek news was good, risk appetite increased and investors borrowed low-yielding euros to fund bets abroad, making the euro fall. When talks floundered, risk appetite diminished and the money came back to Europe, helping the euro rise."
That's an interesting perspective. Of course, you may have seen our own account of what happened to the euro-dollar exchange rate around the time of the Greek deal. From our point of view, the pair simply followed its Elliott wave script. And, in fact, the latest price action in EURUSD has again served us a useful Elliott wave lesson.
There is a wave pattern called an "ending diagonal triangle." As the name implies, it's an ending pattern. It only appears in 5th, final wave of the basic 12345 Elliott wave sequence. Here's its idealized diagram, in a bull market (for a bear market, flip it upside down):
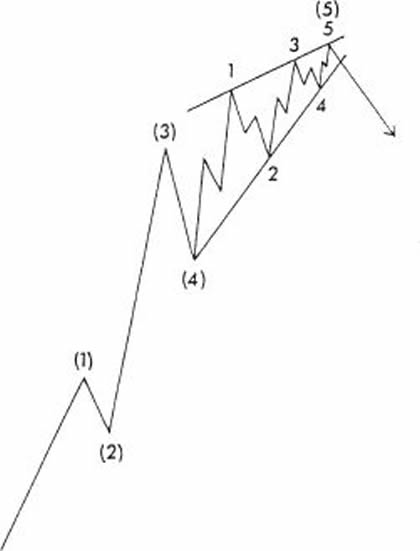
Now, the useful thing about Elliott waves is that once you spot a particular pattern, you can make very precise forecasts where the market should move next -- because the price should simply follow the pattern's idealized path. (There are no foolproof forecasting methods, of course, but Elliott really allows you to narrow down the infinite number of future possibilities to a handful of probabilities.)
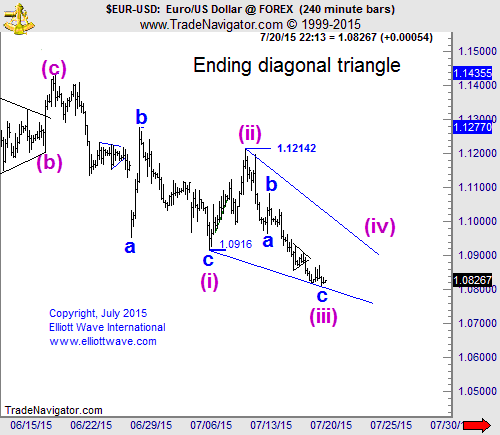
So, back to our ending diagonal triangle. On July 20, with EURUSD trading around 1.08, our Currency Pro Service team spotted a budding ending diagonal on a euro chart (partial Elliott wave labels shown on all charts). It called for a rally:
EURUSD
[Posted On:] July 20, 2015 07:50 PM
[Bottoming?] ...the ending diagonal triangle is now our working model. ...if we saw impulsive price action moving above 1.0870 it might provide some preliminary evidence.
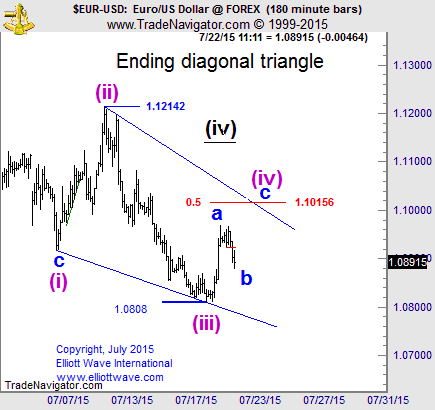
The very next day, EURUSD popped higher (below). Now, within and ending diagonal, each leg is supposed to develop in three waves, ABC. So, our Currency Pro Service team labeled the rally a wave A, with a pullback in wave B due next (and then another rally in wave C). On July 21, we wrote:

EURUSD
[Posted On:] July 21, 2015 06:09 PM
...the rise should be wave a. The current pullback would therefore be...wave b... It should likely test... a 38.2% Fibonacci support at 1.0907. Once we can pinpoint the bottom of wave b, we'll have a better sense of the upside prospects for wave c.
Next day, the expected pullback in wave B came on cue:
Next, the ending diagonal triangle pattern called for a C rally. It also developed nicely, hitting our upper price target:
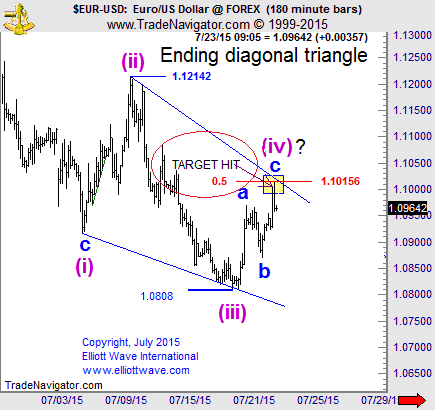
At this point, the ABC leg (of wave 4) of the developing ending diagonal triangle was complete. So, next our Currency Pro Service expected a sell-off -- which we saw on July 23 and 24:
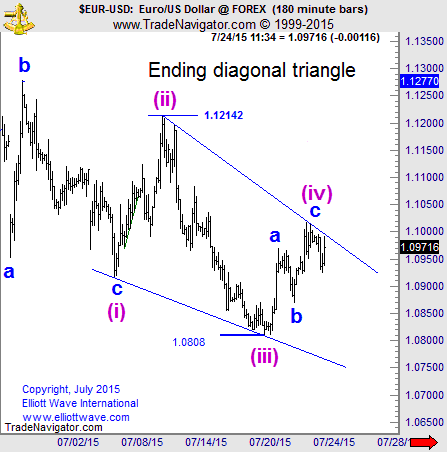
You can surmise from the idealized ending diagonal diagram above that next EURUSD should see more weakness, to complete the pattern. Will it come? There are no guarantees, but it would be surprising if an Elliott wave pattern which guided our Currency Pro Service team so beautifully all week would suddenly "misfire."
We'll have to wait and see what political, economic or other news the mainstream headlines will blame the next move in EURUSD on. The good news is, with Elliott wave analysis in your toolbox, you have to do a lot less guessing.
|
"Trading Forex: How the Elliott Wave Principle Can Boost Your Forex Success"In this free 14-page eBook, our Senior Currency Strategist Jim Martens pulls from 25+ years of experience to show how to use Elliott wave to improve your analysis of the currency markets. Learn how you can put the power of the Wave Principle to work in your forex trading. |

This article was syndicated by Elliott Wave International and was originally published under the headline EURUSD: An Ending Diagonal Triangle in Action. EWI is the world's largest market forecasting firm. Its staff of full-time analysts led by Chartered Market Technician Robert Prechter provides 24-hour-a-day market analysis to institutional and private investors around the world.
About the Publisher, Elliott Wave International
Founded in 1979 by Robert R. Prechter Jr., Elliott Wave International (EWI) is the world's largest market forecasting firm. Its staff of full-time analysts provides 24-hour-a-day market analysis to institutional and private investors around the world.
© 2005-2022 http://www.MarketOracle.co.uk - The Market Oracle is a FREE Daily Financial Markets Analysis & Forecasting online publication.