


Crude Oil Price Sinking or Rebounding?
Commodities / Crude Oil Sep 03, 2015 - 10:57 AM GMTBy: Nadia_Simmons

 Trading position (short-term; our opinion): No speculative positions are justified from the risk/reward perspective.
On Tuesday, crude oil reversed and declined sharply as weak Chinese data weighed on investors' sentiment. As a result, the commodity approached support levels, but will they encourage oil bulls to act in the coming days?
Yesterday's official data showed that Chinese manufacturing PMI dropped to 49.7 in the previous month, which was the lowest reading since August 2012. In this way, China's manufacturing purchasing managers' index slipped under the 50-point level, which indicated industry contraction and raised concerns that Chinese demand for oil will decline (China imports more than 5.65 million barrels of crude oil per day, which makes the country the world's second-largest importer of oil beyond the U.S.). Thanks to these circumstances, light crude declined sharply and approached important support levels. What's next for crude oil? (charts courtesy of http://stockcharts.com).
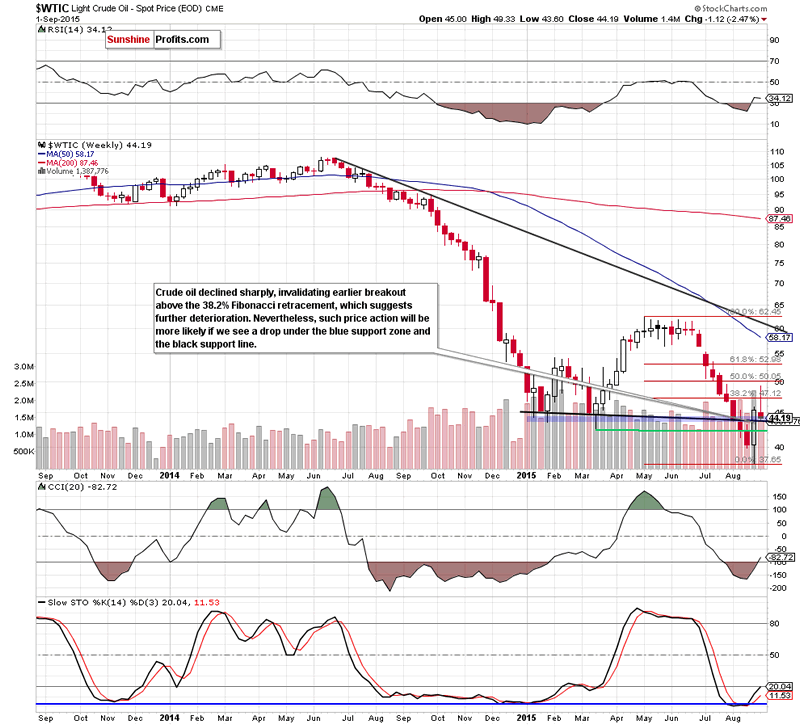
Looking at the weekly chart we see that the proximity to the 50% Fibonacci retracement encouraged oil bears to act, which resulted in a sharp decline. With this downward move, light crude invalidated earlier breakout above the 38.2% Fibonacci retracement, which s a negative signal that suggests further deterioration. Nevertheless, in our opinion such price action will be more likely and reliable if we see a drop under the blue support zone (based on the Jan lows) and the previously-broken black support line (based on Jan and Mar weekly closing prices).
Having said that, let's take a closer look at the daily chart and find out what impact did this sharp decline have on the very short-term chart.
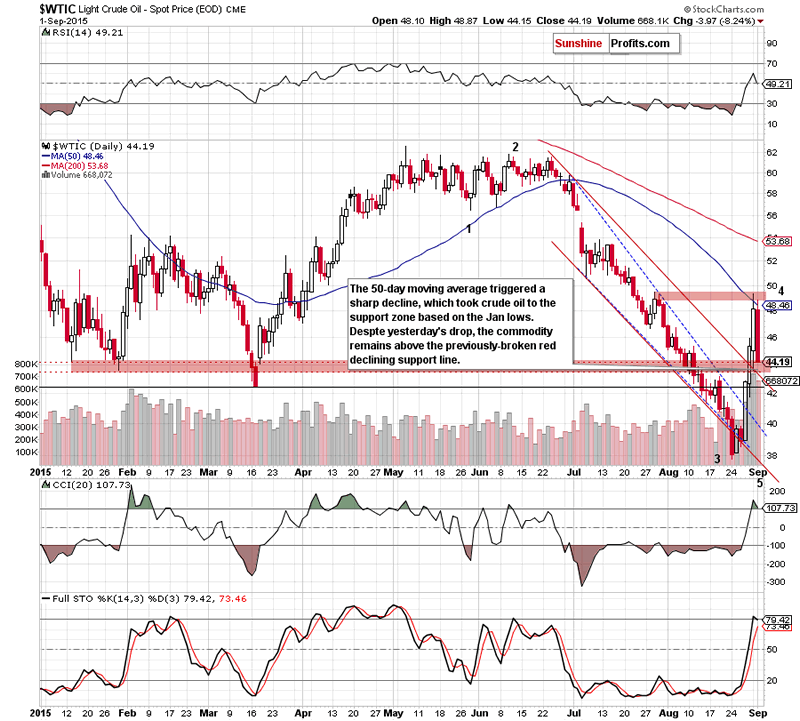
From this perspective we see that the 50-day moving average stopped further improvement, triggering a sharp decline. As a result, light crude erased 40% of earlier rally and reached the support zone created by the Jan lows (marked with red), which could trigger a rebound from here in the coming day(s). Nevertheless, the current position of the indicators (the CCI and Stochastic Oscillator are overbought) suggests that further deterioration is just around the corner.
If the commodity extends decline, the initial downside target would be around $43, where the previously-broken red declining support line (the upper border of the red declining trend channel) is. At this point, it is worth noting that if crude oil drops under this key support line, the current decline will accelerate and the probability of another profitable transaction will increase. Until this time, in our opinion, the overall situation is too unclear to open any positions.
Summing up, crude oil declined sharply and approached support levels, which could trigger a rebound and another test of the 50-day moving average in the coming day(s).
Very short-term outlook: mixed
Short-term outlook: bearish
MT outlook: bearish
LT outlook: mixed with bearish bias
Thank you.
Nadia Simmons
Forex & Oil Trading Strategist
Przemyslaw Radomski
Founder, Editor-in-chief
Sunshine Profits: Gold & Silver, Forex, Bitcoin, Crude Oil & Stocks
Stay updated: sign up for our free mailing list today
* * * * *
Disclaimer
All essays, research and information found above represent analyses and opinions of Nadia Simmons and Sunshine Profits' associates only. As such, it may prove wrong and be a subject to change without notice. Opinions and analyses were based on data available to authors of respective essays at the time of writing. Although the information provided above is based on careful research and sources that are believed to be accurate, Nadia Simmons and his associates do not guarantee the accuracy or thoroughness of the data or information reported. The opinions published above are neither an offer nor a recommendation to purchase or sell any securities. Nadia Simmons is not a Registered Securities Advisor. By reading Nadia Simmons’ reports you fully agree that he will not be held responsible or liable for any decisions you make regarding any information provided in these reports. Investing, trading and speculation in any financial markets may involve high risk of loss. Nadia Simmons, Sunshine Profits' employees and affiliates as well as members of their families may have a short or long position in any securities, including those mentioned in any of the reports or essays, and may make additional purchases and/or sales of those securities without notice.
© 2005-2022 http://www.MarketOracle.co.uk - The Market Oracle is a FREE Daily Financial Markets Analysis & Forecasting online publication.