


Oil Stocks - Interim or Major Reversal?
Commodities / Crude Oil Sep 05, 2015 - 01:17 PM GMTBy: Nadia_Simmons

 In the second half of August, Chinese equities have been under heavy selling pressure as a fear over China's slowing economy and worries that Beijing may allow the Yuan to continue to depreciate have weighed on investors' sentiment. Moreover, disappointing economic data fuelled that fears, which resulted in a sharp decline on China's stock market. In less than two weeks, the Shanghai Composite declined from (almost) 4,000 below the next psychologically important barrier of 3,000, hitting fresh 2015 lows.
That situation raised concerns that the plunge could spread to other parts of the Chinese economy, triggering fears that Chinese demand for oil will decline (China imports more than 5.65 million barrels of crude oil per day, which makes the country the world's second-largest importer of oil beyond the U.S.). Thanks to these circumstances, light crude hit a fresh multi-year low of $37.75 and the XOI approached the barrier of 1,000, but is the worst behind oil bulls? Let's take a look at the charts below and try to answer these questions (charts courtesy of http://stockcharts.com).
![]() Larger Image
Larger Image
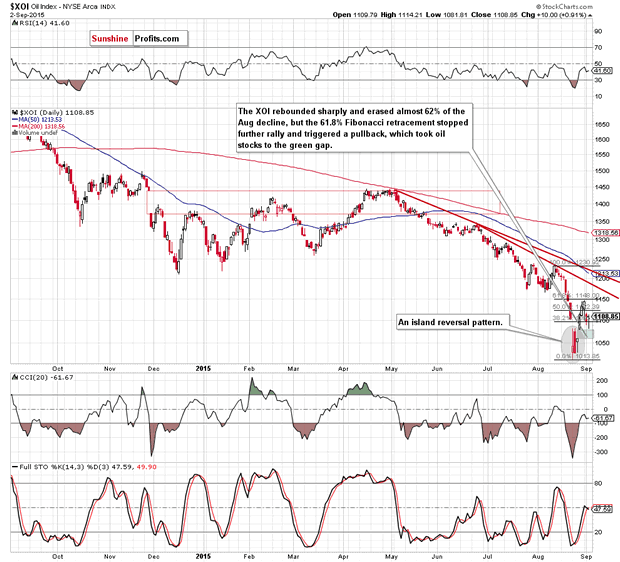
Looking at the daily chart we see that oil stocks rebounded sharply after sizable declines and erased almost 62% of them. However, the 61.8% Fibonacci retracement encouraged oil bears to act, which resulted in a pullback. With this downward move, the XOI slipped to the green gap (it serves as the nearest support), which suggests that we'll likely see a rebound from here in the coming days. Additionally, at this point, we would like to draw your attention to the island reversal pattern, which suggests that the final bottom may be already in.
Are there any other technical factors that could confirm the above? Let's check the weekly chart and find out.
![]() Larger Image
Larger Image
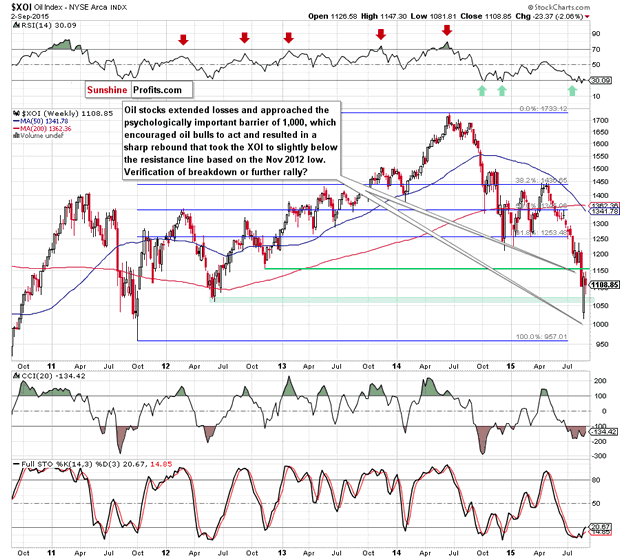
From this perspective, we see that oil stocks extended losses and approached the psychologically important barrier of 1,000 in the previous week (an intraweek low of 1,015). As you see, the proximity to this level encouraged oil bulls to act and resulted in a sharp rebound that took the XOI to slightly below the previously-broken resistance line based on the Nov 2012 low. What's next? Taking into account the short-term picture and the current position of the weekly indicators, it seems that oil bulls will try to push the index higher in the coming week(s).
However, to have a more complete picture of oil stocks, let's focus on the long-term chart. What can we infer from it?
![]() Larger Image
Larger Image
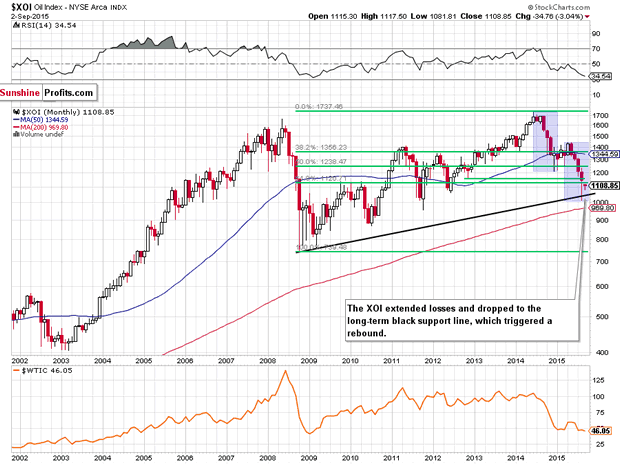
The first thing that catches the eye on the monthly chart is a drop to the long-term black support line based on the Oct 2008 and Mar 2009 lows. As you see, this solid support triggered a sharp rebound, which suggests that even if oil stocks move lower once again, this key support line will likely stop oil bears once again. On top of that, the Apr-Aug decline is almost the same as declines between June and December 2014, which increases the probability of reversal and higher values of the XOI in the coming weeks (or even months).
Summing up, oil stocks extended losses and declined to very important support zone created by the long-term black support line (based on the Oct 2008 and Mar 2009 lows) and the barrier of 1,000. This area triggered a sharp rebound, which created the island reversal pattern on the daily chart and erased almost 62% of the Aug declines. All the above suggests that higher values of oil stocks are just around the corner (even if oil stocks moves lower once again, the above-mentioned key support zone will be strong enough to stop oil bears and further deterioration).
Thank you.
Nadia Simmons
Forex & Oil Trading Strategist
Przemyslaw Radomski
Founder, Editor-in-chief
Sunshine Profits: Gold & Silver, Forex, Bitcoin, Crude Oil & Stocks
Stay updated: sign up for our free mailing list today
* * * * *
Disclaimer
All essays, research and information found above represent analyses and opinions of Nadia Simmons and Sunshine Profits' associates only. As such, it may prove wrong and be a subject to change without notice. Opinions and analyses were based on data available to authors of respective essays at the time of writing. Although the information provided above is based on careful research and sources that are believed to be accurate, Nadia Simmons and his associates do not guarantee the accuracy or thoroughness of the data or information reported. The opinions published above are neither an offer nor a recommendation to purchase or sell any securities. Nadia Simmons is not a Registered Securities Advisor. By reading Nadia Simmons’ reports you fully agree that he will not be held responsible or liable for any decisions you make regarding any information provided in these reports. Investing, trading and speculation in any financial markets may involve high risk of loss. Nadia Simmons, Sunshine Profits' employees and affiliates as well as members of their families may have a short or long position in any securities, including those mentioned in any of the reports or essays, and may make additional purchases and/or sales of those securities without notice.
© 2005-2022 http://www.MarketOracle.co.uk - The Market Oracle is a FREE Daily Financial Markets Analysis & Forecasting online publication.