


Stock Market Brace Yourself!
Stock-Markets / Stock Markets 2015 Sep 11, 2015 - 04:46 PM GMTBy: Puru_Saxena

 BIG PICTURE - Last month, the multi-month trading range on Wall Street ended with an abrupt break to the downside and once key support levels were violated, we witnessed an epic swoon! Thereafter, due to direct stock buying by the Chinese policymakers, the stock markets stabilised somewhat and we got a sharp relief rally.
As things stand today, we have already had the initial plunge from the multi-month distribution pattern and after the bounce; the S&P500 Index is now trading just beneath an area of overhead resistance (Figure 1). Going forwards, we are of the view that the bellwether index will struggle to get past the two zones of overhead resistance depicted on the chart. Even if it does surpass those levels, the now declining 200-day moving average (red line on chart) should keep the festivities in check.
It is noteworthy that unlike the previous pullbacks during the recently deceased bull market, this plunge occurred after a significant deterioration in the market's internals. You will recall that in last month's Money Matters titled "Is this the summit?" we covered the bearish developments in detail, so the recent break in the stock market was not a surprise event or a black swan.
Figure 1: S&P500 Index (daily chart)
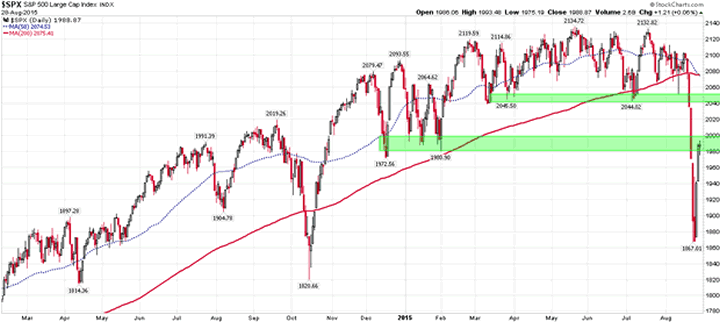
Source: www.stockcharts.com
So, unless the Federal Reserve gives the market another massive dose of QE, it is unlikely that the S&P500 Index will climb to new highs over the coming months. If anything, given the extremely poor market breadth and recent spike in credit spreads, it is probable that the ongoing rally in the stock market will fail soon and at the very least, we will get a test of the recent low. Moreover, if the recent low does not hold, the bear market will gain momentum and we may witness an autumn plunge!
At this stage, nobody can guarantee whether the recent panic low will hold but we suspect that the stock market will slice through that level. In fact, unless the Federal Reserve unleashes QE4 soon, it is conceivable that the US stock market may give back almost all of its QE3 gains. Under this scenario, the S&P500 Index could decline over the following months and we may bottom out around the 1,300-1,450 level.
Look. The recently concluded bull market was supported by the desperate search for yield caused by the Federal Reserve's unprecedented bond buying program. In fact, if you review the data since 2009, you will note that there is a very significant correlation between the size of the Federal Reserve's balance-sheet and the direction of the S&P500 Index. Put simply, over the past 6 years, whenever the Federal Reserve's balance-sheet expanded, US stocks rose in value and when the central bank stopped buying bonds, Wall Street faced selling pressure. Given this tight relationship, it is hardly surprising that the lengthy bull market ran into trouble shortly after the Federal Reserve stopped its QE program.
Today, many market commentators and talking heads on TV are claiming that the recent swoon is simply a routine correction within the ongoing bull market and that the major indices will soon rally to new highs. Although there are no certainties in this business, we believe that the odds of new highs over the coming months are extremely low and if anything, prices are likely to deflate over the foreseeable future.
If you review Figure 2, you will note that the recent stock market decline was vicious enough to take the Dow Jones Industrial Average out of its multi-year trading channel and it will now take a lot of effort on the part of the bulls to push the index back above its upward sloping trend line. Furthermore, it is worth noting that the 10-week moving average has now also slipped beneath the 40-week moving average, so this bearish technical development will also act as a headwind for the bulls.
Figure 2: Dow Jones Industrial Average (weekly chart)
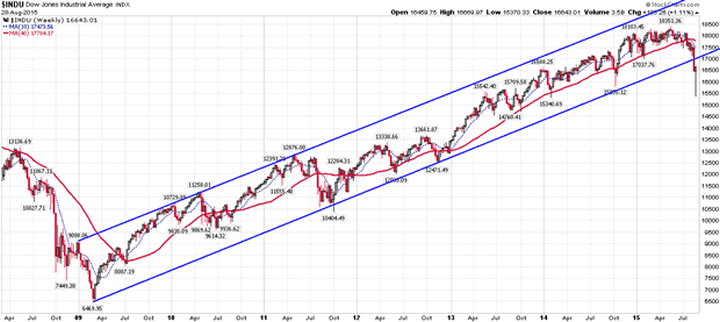
Source: www.stockcharts.com
It is interesting to note that although the stock market bounced off the recent panic lows, volume remained relatively subdued on the up days and most stocks are still trading beneath the 200-day moving average. In fact, approximately 78% of the NYSE stocks are still under this key technical level and the number of new 52-week highs is still negligible. More importantly, the NYSE Advance/Decline is still in a downtrend and this implies that the market's breadth remains very weak.
Given the above technical data, lofty stock market valuations and the ongoing slowdown in the world economy, we are of the opinion that the downside risks currently outweigh the potential for any sustainable upside.
As far as the real economy goes, there can be no doubt that China's debt bubble is now deflating and bad loans are rising (around 30% year-on-year increase in the four largest banks). Elsewhere, the tightening liquidity conditions are adversely affecting the currencies and economies of the emerging nations. Last but not least, the ongoing slowdown in China is seriously hurting the commodity exporting nations and their economies and currencies are in trouble.
Over in the developed world, despite the ongoing QE program in Japan, its economy is struggling and the nation's recent industrial production print showed a contraction. Apart from Japan, several other developed economies in Asia are also feeling the heat and their currencies have depreciated significantly against the US Dollar.
The situation is somewhat similar in Europe where the European Central Bank's QE initiative is not doing much to revive economic activity. In fact, despite the ongoing bond buying program, European stock markets have declined since spring and this is a negative development.
As you can see from Figure 3, the Euro Stoxx 50 Index topped out in April and it has now sliced through its recent low. More importantly, it is now trading below the 200-day moving average and the path of least resistance appears to be down.
Figure 3: Euro Stoxx 50 Index (daily chart)
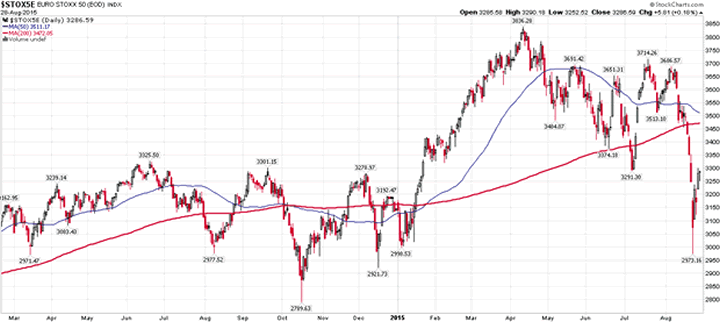
Source: www.stockcharts.com
Given the debt overhang in the world (282% of GDP!), most nations appear to be caught in a liquidity trap and this is why record low interest rates are not boosting business activity. Remember, economic growth is directly correlated to private-sector debt creation and if over-indebted households are unwilling/unable to borrow more and spend, then central banks' QE programs and other injections of liquidity cannot assist the economy.
Although QE has expanded the central banks' balance-sheets, due to a lack of demand for new loans, the newly created currency units have just accumulated as commercial banks' reserves. This lack of appetite for new loans and low money velocity explains why QE has not caused high inflation/hyperinflation or indeed, economic prosperity.
After all, central banks can increase the reserves by injecting liquidity via QE, but given the extreme over-indebtedness, they cannot force households to borrow even more and spend. This lack of demand for new debt (liquidity trap) is the primary reason why monetary policy has now become ineffective and despite record low interest rates for years, reported inflation is near zero throughout the developed world.
If you are unsure about our prognosis, you need to look no further than Japan which has been stuck in an epic liquidity trap for two decades and despite huge amounts of 'stimulus' over the years, its economy has barely grown. Now, we are not claiming that both Europe and the US will stay in this quagmire for another decade; but the problems are not likely to be resolved in the near future.
Turning to Asia, China's economy is in real trouble and despite the official 7% GDP growth print; it is worth noting that its four largest banks reported no earnings growth during the first half of this year! Elsewhere, China's power usage grew by just 2% over the past year and its official Purchasing Managers' Index fell to a 3-Year low of 49.7 in August (below 50 implies contraction).
When you consider the above data and the fact that shipping/freight rates on the Asian routes have plunged over the past few months and the CRB Index is trading at a 16-year low, you do not have to be a rocket scientist to figure out that the Chinese economy cannot be growing at 7% per annum.
The Chinese stock market seems to agree with our bearish thesis and this is why the Shanghai Composite Index is now trading at a multi-month low (Figure 4). It is notable that over the past couple of months, Beijing has spent US$200 billion propping up China's stock market and if it was not for this intervention, the Shanghai Composite would be even lower today.
Figure 4: Shanghai Composite Index (daily chart)
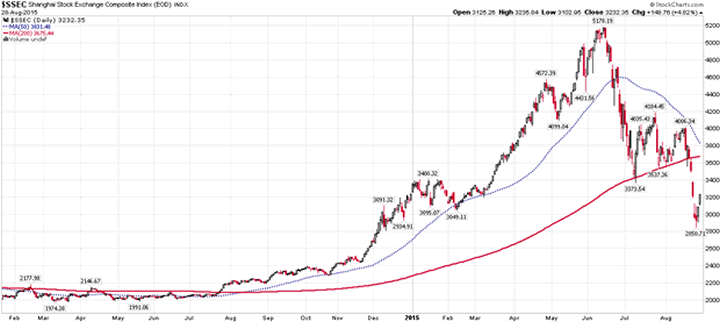
Source: www.stockcharts.com
Elsewhere in Asia, (as per our expectation) the currencies of many nations have depreciated sharply over the past year and this is due to the tightening liquidity conditions created by the end of the Federal Reserve's QE program. In addition to the currencies, the stock markets of these nations have also fallen sharply and this is bad news for Asian consumption; thus global growth.
Today, many market commentators are claiming that somehow the US will remain insulated from the overseas economic troubles and amidst the ongoing turmoil; Wall Street will remain the island of safety. Although anything can happen, we disagree with this view and believe that if things get ugly, all stock markets will come under pressure. After all, the S&P500 companies derive approximately 35% of their earnings from overseas so it may be naïve to assume that American business will not be affected by troubles in other parts of the world.
In summary, we are of the opinion that the bull market on Wall Street is now in the rear view mirror and we are in the early stages of a primary downtrend (bear market). Currently, the stock market is enjoying a relief rally from an oversold position but the advance is not likely to be durable. Consequently, we no longer have any 'long' positions in stocks and approximately 40% of our managed capital is now invested in long-term US government bonds (which should appreciate during a deflationary contraction). Last but not least, in order to benefit from the nascent downtrend in stocks, we have established modest 'short' positions in the most vulnerable sectors. So, if the stock market sells off in earnest, our managed portfolios should do quite well.
Puru Saxena is the CEO of Puru Saxena Wealth Management, his Hong Kong based SFC regulated firm which offers discretionary portfolio management and research services to individual and corporate clients. The firm manages two trend-following strategies – Discretionary Equity Portfolio and Discretionary Fund portfolio. In addition, the firm also manages a Discretionary Blue-chip Portfolio which invests in high-dividend world leading companies. Performance data of these strategies is available from www.purusaxena.com
Puru Saxena also publishes Money Matters, a monthly economic report, which identifies trends and highlights investment opportunities in all major markets. In addition to the monthly report, subscribers of Money Matters also receive “Weekly Updates” covering the recent market action. Money Matters is available by subscription from www.purusaxena.com
Puru Saxena
Website – www.purusaxena.com
Puru Saxena is the founder of Puru Saxena Wealth Management, his Hong Kong based firm which manages investment portfolios for individuals and corporate clients. He is a highly showcased investment manager and a regular guest on CNN, BBC World, CNBC, Bloomberg, NDTV and various radio programs.
Copyright © 2005-2015 Puru Saxena Limited. All rights reserved.
Disclaimer: The above is a matter of opinion provided for general information purposes only and is not intended as investment advice. Information and analysis above are derived from sources and utilising methods believed to be reliable, but we cannot accept responsibility for any losses you may incur as a result of this analysis. Individuals should consult with their personal financial advisors.© 2005-2022 http://www.MarketOracle.co.uk - The Market Oracle is a FREE Daily Financial Markets Analysis & Forecasting online publication.