


Copper Bear Market Rally Underway
Commodities / Copper Sep 20, 2015 - 08:18 AM GMTBy: Austin_Galt

 Copper has rallied recently and I believe this to be the start of a significant bear rally. Let's analyse the technicals of the daily, weekly and monthly charts.
Copper Daily Chart
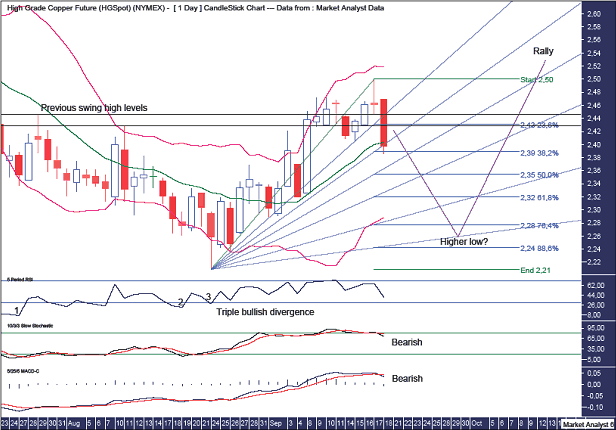
I have drawn two horizontal lines which denote previous swing high levels. Price recently traded above both these levels so we have a higher high in place.
The recent low set up a triple bullish divergence on the RSI which often leads to a significant rally.
The Stochastic and MACD indicators have just turned bearish which leads me to believe price is now headed down to put in a higher low.
The Bollinger Bands show price back at the middle band which may provide temporary support while I expect price to eventually get back to the lower band.
I have added Fibonacci retracement levels of the move up from recent low to recent high. The first correction in a new bull trend often makes a deep correction and I am targeting around the 76.4% level at $2.28 to bring in the higher low.
I have drawn a Fibonacci Fan and I suspect the higher low will be back down around support from the 88.6% angle.
Copper Weekly Chart
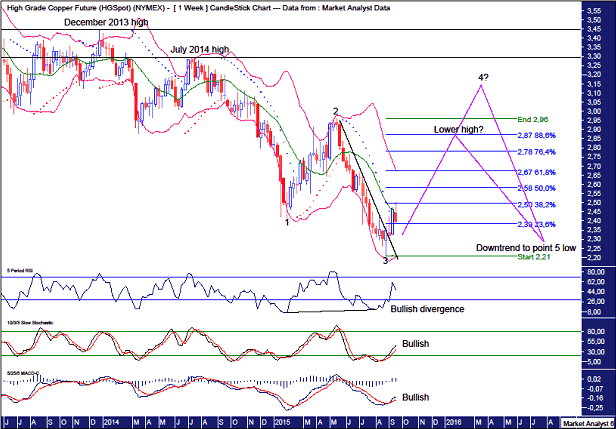
I have drawn a downtrend line and price has busted above it indicating a short term uptrend is now in play.
The recent low showed a bullish divergence on the RSI while both the Stochastic and MACD indicators are now bullish.
The PSAR indicator has a bullish bias after price busted the dots on the upside the week before last. I suspect price may now go down to test this indicator support with the dots now on the downside.
The Bollinger Bands show price is now at the middle band. Perhaps price does some work around this band before heading to the upper band.
I have added Fibonacci retracement levels of the move down from recent high to recent low. My minimum expectation for this rally is a deep retracement up to at least the 76.4% level at $2.78. If a lower high is put in then I actually favour even higher up around the 88.6% level at $2.87.
However, my personal opinion is that an even greater rally is set to occur. There is the potential for a 5 point broadening low to form. If that is the case then price is now headed up to put in a point 4 high which would need to be above the point 2 high at $2.96. After that, price should resume the downtrend to a point 5 low.
I have drawn two horizontal lines which denote previous swing highs set in July 2014 and December 2013 at $3.29 and $3.45 respectively. I expect price to turn back down below these levels.
Copper Monthly Chart
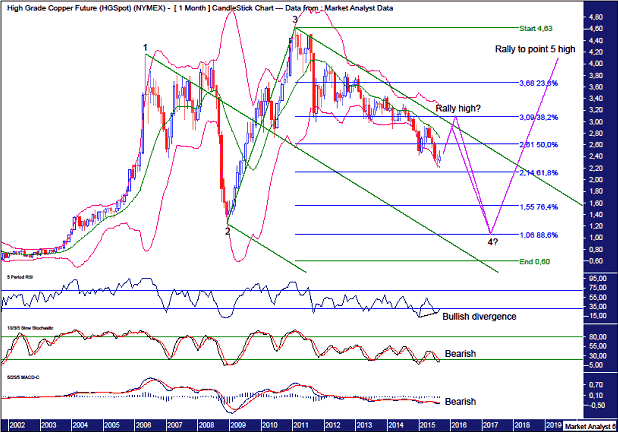
The RSI shows a bullish divergence at the recent low.
The Stochastic and MACD indicators are both still bearish but a solid rally now would change that if only for a short time.
The Bollinger Bands show price appears to be leaving the lower band. A lower high would likely see price turn down around the middle band while a more substantial rally, which I favour, would see price turn back down around the upper band.
I have drawn an Andrew's Pitchfork and I am looking for price to find resistance at the upper channel and possibly make a false break above it.
As outlined in previous analysis, there appears to be a massive 5 point broadening top in play with price now headed down to put in a point 4 low. This would need to be below the point 2 low which stands at $1.25.
I have added Fibonacci retracement levels of the whole bull market and I am targeting the final point 4 low to be around the 88.6% level which stands at $1.06.
Summing up, I believe a significant bear rally is underway. Once the rally high is in place then I expect the downtrend to resume and gain momentum.
By Austin Galt
Austin Galt is The Voodoo Analyst. I have studied charts for over 20 years and am currently a private trader. Several years ago I worked as a licensed advisor with a well known Australian stock broker. While there was an abundance of fundamental analysts, there seemed to be a dearth of technical analysts. My aim here is to provide my view of technical analysis that is both intriguing and misunderstood by many. I like to refer to it as the black magic of stock market analysis.
Email - info@thevoodooanalyst.com
© 2015 Copyright The Voodoo Analyst - All Rights Reserved
Disclaimer: The above is a matter of opinion provided for general information purposes only and is not intended as investment advice. Information and analysis above are derived from sources and utilising methods believed to be reliable, but we cannot accept responsibility for any losses you may incur as a result of this analysis. Individuals should consult with their personal financial advisors.
Austin Galt Archive |
© 2005-2022 http://www.MarketOracle.co.uk - The Market Oracle is a FREE Daily Financial Markets Analysis & Forecasting online publication.