


Gold: The End and The Beginning
Commodities / Gold and Silver 2015 Sep 22, 2015 - 04:39 PM GMTBy: DeviantInvestor

 Gold prices peaked in January 1996 and then fell for 3.5 years into a multi-decade low. It was the age of stocks, debt, leverage, and good times; nobody needed or wanted gold.
Since the gold price peak in 2011 the Federal Reserve has “generously” supplied the world with trillions of dollars of newly created digital and paper debt, all backed by nothing but faith and credit. Bonds have rallied and the S&P is higher by 50% or so. The Japanese Central Bank has similarly produced trillions of yen, bought stocks and bonds, and extended their recession several more years.
Yes, the past four years have been a repeat of the age of stocks, debt, and leverage, but only the financial and political elite experienced good times. Debt is massively higher and gold is still bumping around a bottom.
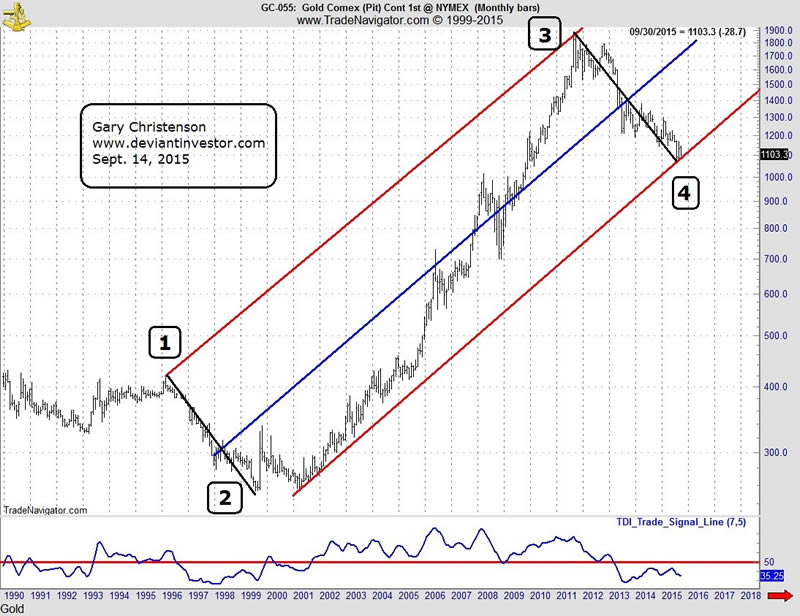
- Gold dropped from about $405 in January 1996 to $253 in July 1999: 38% in 42 months.
- Gold dropped from about $1900 in August 2011 to $1070 in July 2015: 44% in 47 months. The drop is similar to the 1996-1999 collapse.
The US national debt has steadily increased. Examine the following two graphs regarding gold and the national debt.
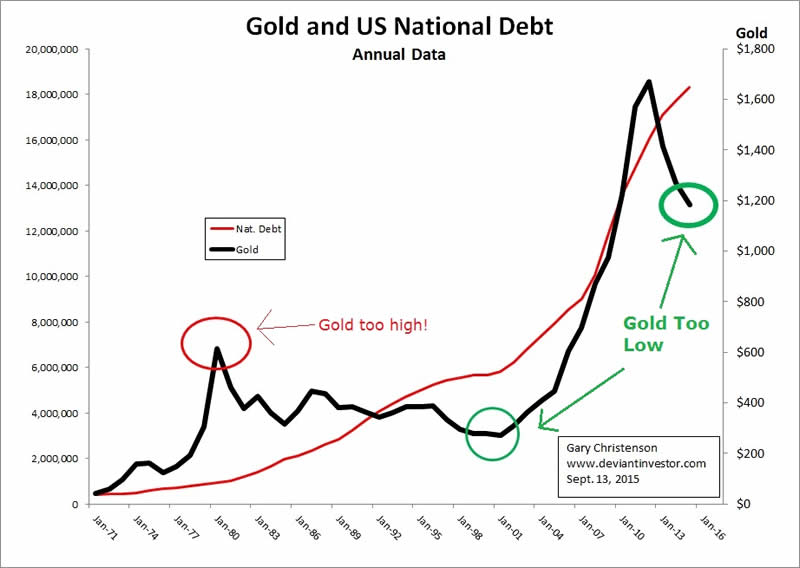
WHAT THESE GRAPHS SHOW:
- Gold prices increase with national debt, with notable exceptions such as 2001 and 2015 – circled in green. Those exceptional prices did/will correct higher to match the upward trend in national debt.
- Gold prices in 2015 are clearly low compared to long term national debt, as they were in 2001. Expect gold prices to rise substantially to compensate for the past four years of declining prices.
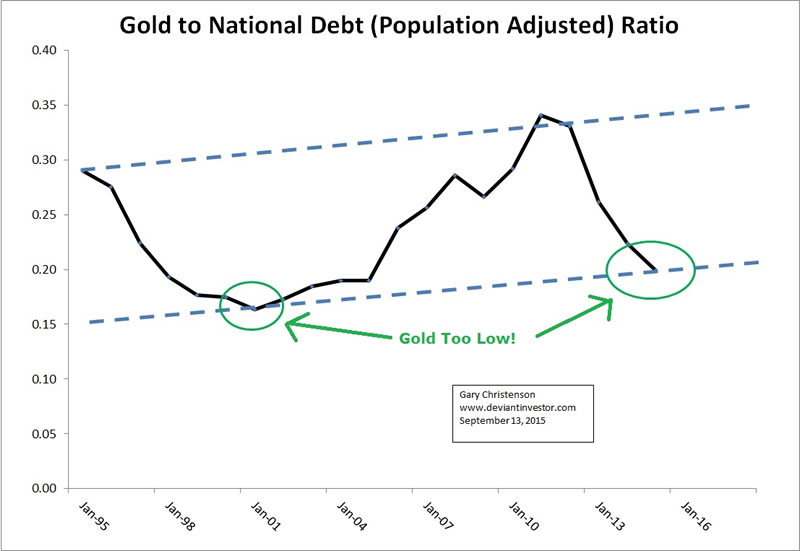
- The ratio of gold to population adjusted national debt for the past 20 years shows that gold prices rise along with both population and the inexorably increasing national debt. Currently the ratio is at the low end of its multi-decade range. Gold prices will rise more rapidly than population and the national debt for several, probably many, years.
Examine the 25 year log scale graph of gold and note points 1 – 4 on the graph.
CONCLUSIONS:
- The sun will rise tomorrow and national debt will continue its exponential increase.
- Gold prices will rise and fall but inevitably follow the increase in money supply and debt. The next big move will be upward to match the exploding national debt.
- The ratio of gold to national debt is currently low, based on decades of history. Expect the ratio to increase in the next several years. Since we absolutely know that national debt will increase, gold prices have considerable upside, even without hyperinflation or a currency collapse.
Gold prices could (I doubt it) fall further in the short term, since High Frequency Trading dominates trading action, and central banks need to hide the fact that their policies and currencies are failing, which usually means they suppress gold prices. Gold was formerly the “canary in the coal mine” indicating the failure of monetary and fiscal policies. But active suppression of gold prices has replaced the “canary” with a plastic look-alike that disguises the warning signal which tells us that something is very wrong with our monetary policies.
However, it is only a matter of time, whether it is days or months, before the consequences of massive debt and uncontrolled “printing” of unbacked debt based fiat currencies sink more of the world into “Venezuela conditions.”
Paper currencies, central banks and delusional paper promises will fail. We need something better. Gold and silver come to mind…
Gary Christenson
GE Christenson aka Deviant Investor If you would like to be updated on new blog posts, please subscribe to my RSS Feed or e-mail
© 2015 Copyright Deviant Investor - All Rights Reserved Disclaimer: The above is a matter of opinion provided for general information purposes only and is not intended as investment advice. Information and analysis above are derived from sources and utilising methods believed to be reliable, but we cannot accept responsibility for any losses you may incur as a result of this analysis. Individuals should consult with their personal financial advisors.
Deviant Investor Archive |
© 2005-2022 http://www.MarketOracle.co.uk - The Market Oracle is a FREE Daily Financial Markets Analysis & Forecasting online publication.