


Falling Wedge Formation Pointing to Higher Gold Price
Commodities / Gold and Silver 2015 Oct 28, 2015 - 10:20 AM GMTBy: Mario_Innecco

Technical analysis has always been a difficult craft to perform as evolving formations sometimes point to certain outcomes but not always do we get these outcomes. Since the great financial crisis of 2008 and the intervention of all major Western central banks in capital markets via their policy of quantitative easing and zero interest rates it has become even more difficult to use technical analysis tools to try and predict market action. With that in mind here is what we think the technical tea leaves are telling us about the gold price.
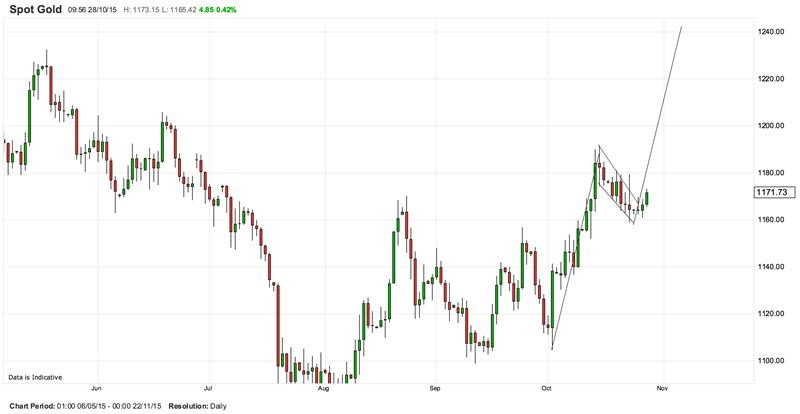
As the chart below shows gold has been on an upward trend since October 2nd, 2015 when it traded at a low of $1105. The move off the October 2nd low was a fairly strong move and it took the price up to $1191.70 on the 15th of October. Since that high on the 15th of October the gold price has been in a falling wedge pattern which basically means gold is taking a breather from the strong up move it made in the first two week of the month. A falling wedge is usually part of a bullish continuation pattern in technical analysis. Note how gold is starting to trade higher today, 28th of October, and it has also broken through the top of the wedge.
Our target for the move higher in gold is around the $1250 level and it looks like it could be another strong and quick move like we saw in the early part of October. As we said earlier technical analysis is not a perfect science so if the the gold price were to fall back below the September 24th high of $1156 this pattern would be negated.
Trade idea: buy the December Comex Gold 1200/1250 call spread. It settled at 4.80 on the 27th of October. If one is able to pay 4.80 that would cost $480 per call spread. If gold is trading at or above $1250 at expiry (24th of November, 2015) your profit would be $5000 minus $480 premium and commission. Or you could buy the 1200 call outright and pay 6.40 or $640 per option contract and if gold were to go even higher than 1250 you would not limit your upside. These options strategies, of course, do not move as quickly as the underlying as they have a delta but they do give you peace of mind as you know in advance what your losses are limited to.
Best regards,
By Mario Innecco
http://forsoundmoney.com
A Futures and Options broker in London for twenty years
Mario Innecco Archive |
© 2005-2022 http://www.MarketOracle.co.uk - The Market Oracle is a FREE Daily Financial Markets Analysis & Forecasting online publication.