


Why The Super Bearish Gold and Silver COTs Portend a Plunging Euro...
Currencies / Euro Nov 01, 2015 - 07:31 PM GMTBy: Clive_Maund

 It was ironic that when Dr Watson complained to his companion Sherlock Homes that he had a stomach ache, Holmes clarified the situation at once by saying "Alimentary, my dear Watson". More generally, the legendary sleuth of Victorian London would make light of his accomplishments after solving cases that baffled the police, by remarking "Elementary, my dear Watson". Doubtless this expression was deeply irritating to his arch-enemy Moriarty.
Today we are going make light of what to other analysts may be abstruse and possibly baffling, by "joining the dots" to demonstrate the linear connection between an extremely bearish silver COT and an imminent crashing euro, so that by the conclusion of this article, you, dear reader, will have a clear understanding of what is set to unfold, and will be able to explain to other confused souls that it really is elementary.
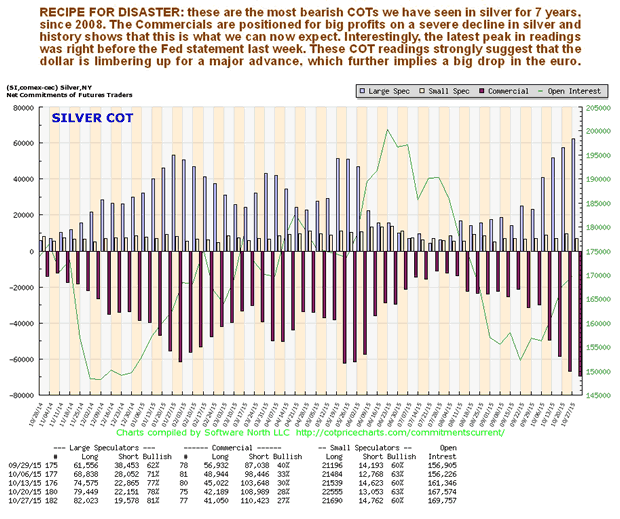
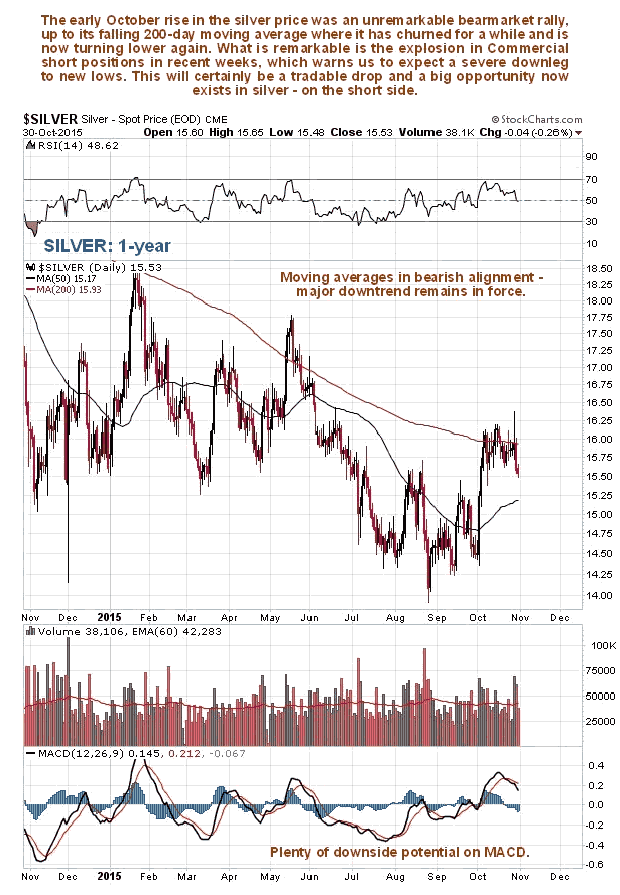
We will start by looking immediately at our most important piece of evidence, the latest silver COT, which is very bearish indeed, because the Commercials now have their biggest short position since 2008. This makes a big drop in silver very likely soon, and it is expected to make new lows, probably heading to the $10 area. Doubt that this is true? – then look at what happened to silver over the past year on its 1-year chart placed directly below the COT chart, when the Commercials had a high short position – I rest my case.
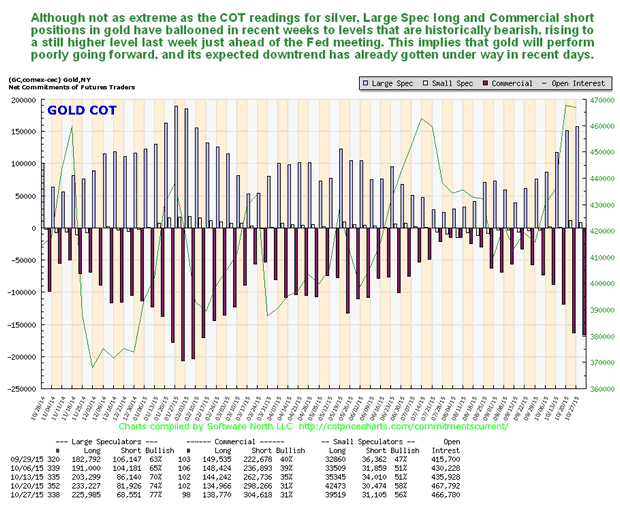
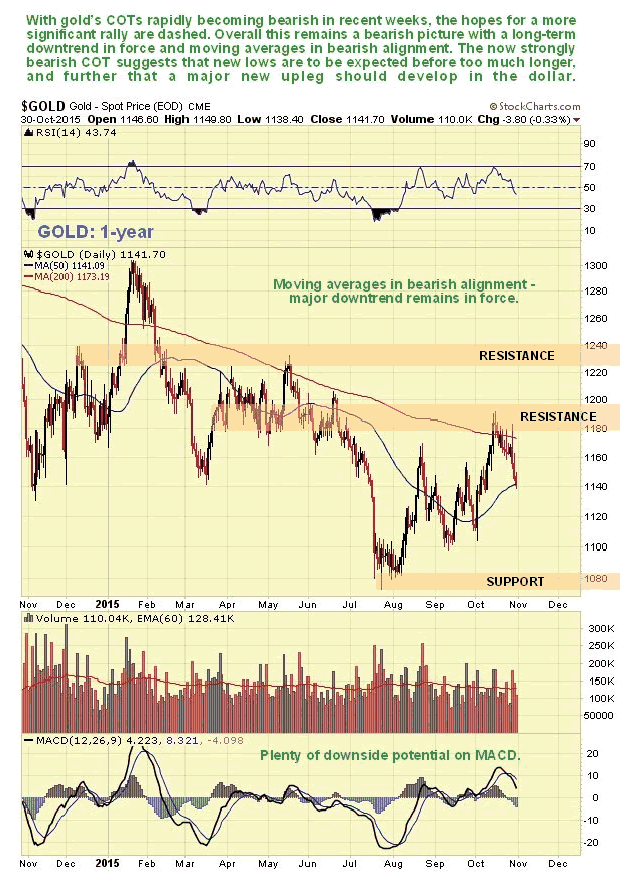
Next we look at gold’s latest COT, with its 1-year chart placed directly below for comparison. It’s similar, although not so extreme as silver, but the conclusion is the same.
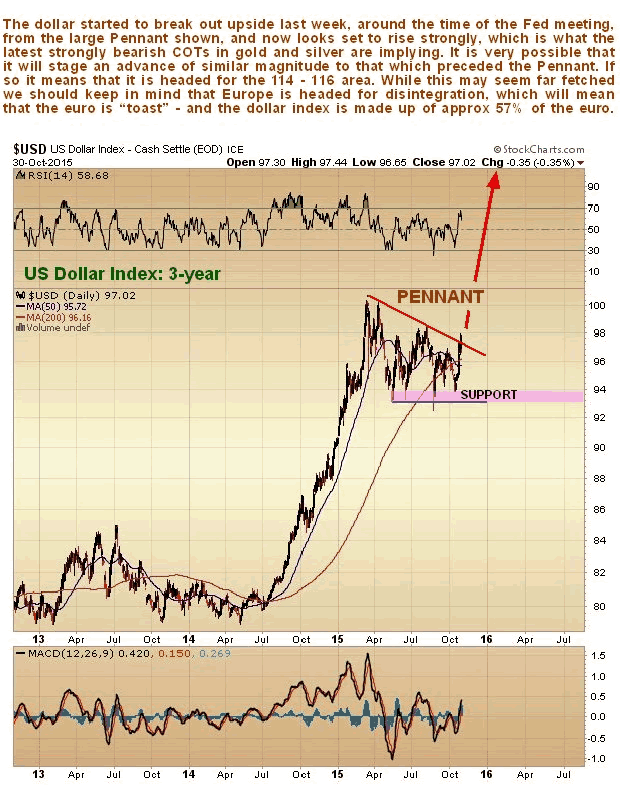
So, gold and silver are going to drop a lot – what does that mean for the dollar? – it means the dollar is going to rally, and rally a lot, and on its 3-year chart we can see that it is in position to do just that. Following its dramatic rally from July of last year to March of this year, the dollar index has been stuck in a large triangular trading range, which could be either a consolidation pattern or a top. It has already started to break out upside from this pattern on the Fed meeting this past week, and it wouldn’t take much to swing its moving averages into bullish alignment. If it succeeds in breaking out upside from this pattern and following through, it is likely to mount an advance of similar magnitude to the one preceding the consolidation pattern, which means it will target the 114 – 116 area, a big move indeed.
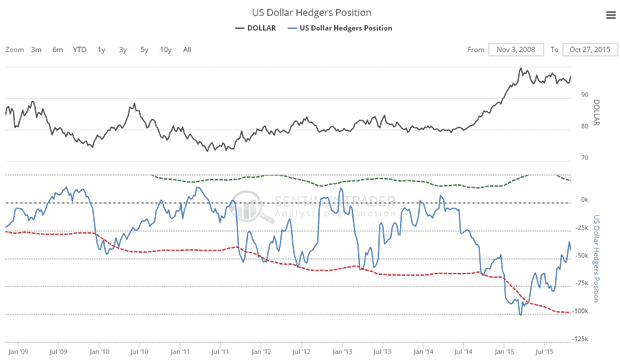
COTs for the US dollar are in middling ground, but have certainly eased enough to permit a big advance, as shown by the latest Hedgers chart, which is a form of COT chart...
If the Fed starts an interest rate rise cycle, it would of course bolster the dollar, but as we know there is precious little scope for them to do so without triggering an economic cataclysm, because of the frightening levels of debt that now exist. So what else could cause the dollar index to rise? the euro, that’s what. Don’t forget that the dollar index is some 57% composed of the euro, and with Europe threatening to fall to bits, crippled as it is by ruinous debts and with political differences between member states being aggravated by differences over how to handle the massive influx of migrants, the euro is really on the ropes and looks like it is starting another major downleg on its road to eventual oblivion. With regards to the migrant crisis, Europe is reaping what it has sown, by joining forces as an obsequious sidekick with the US in its destabilizing rampage around the Mid-East. It’s alright for the US, the migrant’s rubber boats can’t make it across the Atlantic, but they sure can make the 20 km crossing from Bodrum to Kos.
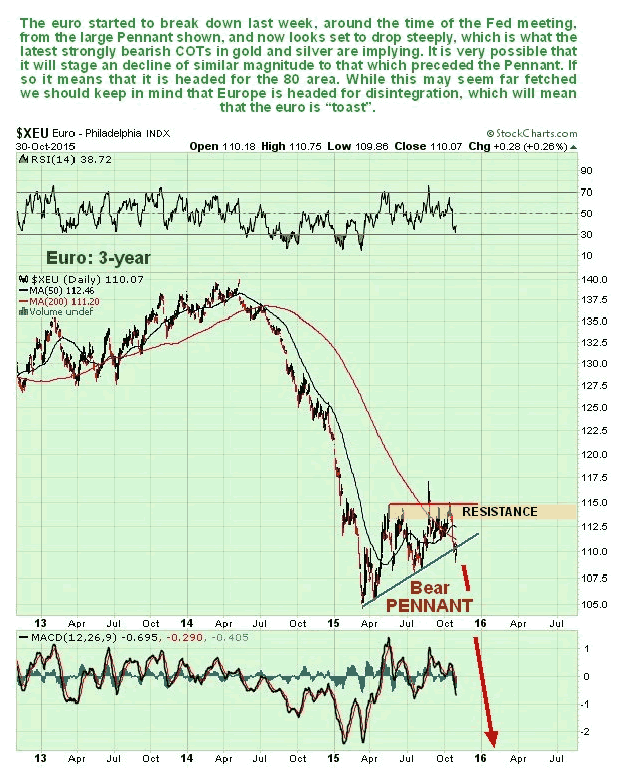
Let’s look at the latest euro chart now. As we just saw, the dollar index is starting to break out upside to start another major upleg, so we can expect to see the opposite occurring in the euro, a major downleg just starting, and that is exactly what we do see. With Europe blighted by huge debts, Germany weakening rapidly as its export markets shrink, its reputation tarnished by the VW scandal, and beset by hordes of immigrants with their hands out so that it looks set to fall to the ground, a constitutional crisis looms for the EU, especially if Britain votes to leave, and the euro is threatened with extinction, so it is not hard to see why the next downleg in the euro could easily be as bad as the one from the Summer of 2014 through the Spring of this year, and if it is, we are looking at the euro dropping to 80 or lower.
If the euro fell this far it means that we will see another huge ramp in the dollar index, which would be expected to trigger a big drop in both gold and silver to new lows. Now you should be able to grasp why the Commercials are piling on the gold and silver shorts – it’s elementary, my dear reader.
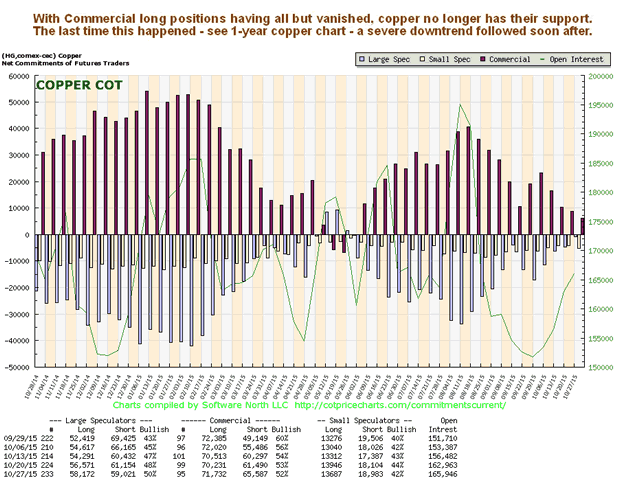
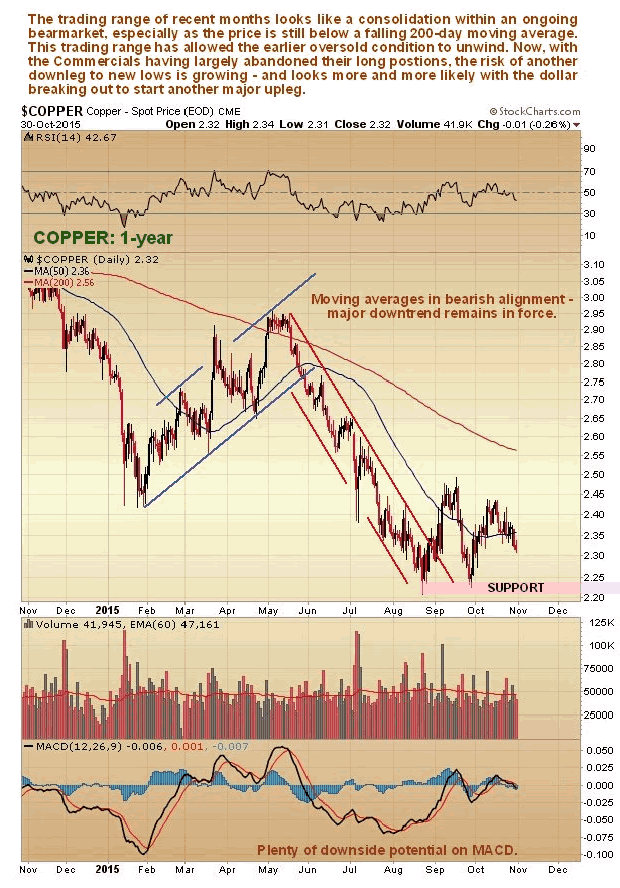
If a big ramp in the dollar ensues it is logical to suppose that many other commodities, apart from gold and silver, will get whacked down again. So let’s take a look at copper and its COT as we would expect this to get hit too. As we can see on the latest COT chart, the Commercials have been "jumping ship" in recent weeks, scaling down their long positions to a very low level. The last time this happened, back in May, a severe downtrend followed as we can see on copper’s 1-year chart, shown directly below the COT chart.
On clivemaund.com we are not going to stand around staring blankly as gold and silver drop away to new lows. This is an opportunity to make big gains on the short side in the PM sector, and we will be looking at a range of vehicles which we can use to do just that, some of which we have already bought over the last week or two.
By Clive Maund
CliveMaund.com
For billing & subscription questions: subscriptions@clivemaund.com
© 2015 Clive Maund - The above represents the opinion and analysis of Mr. Maund, based on data available to him, at the time of writing. Mr. Maunds opinions are his own, and are not a recommendation or an offer to buy or sell securities. No responsibility can be accepted for losses that may result as a consequence of trading on the basis of this analysis.
Mr. Maund is an independent analyst who receives no compensation of any kind from any groups, individuals or corporations mentioned in his reports. As trading and investing in any financial markets may involve serious risk of loss, Mr. Maund recommends that you consult with a qualified investment advisor, one licensed by appropriate regulatory agencies in your legal jurisdiction and do your own due diligence and research when making any kind of a transaction with financial ramifications.
Clive Maund Archive |
© 2005-2022 http://www.MarketOracle.co.uk - The Market Oracle is a FREE Daily Financial Markets Analysis & Forecasting online publication.